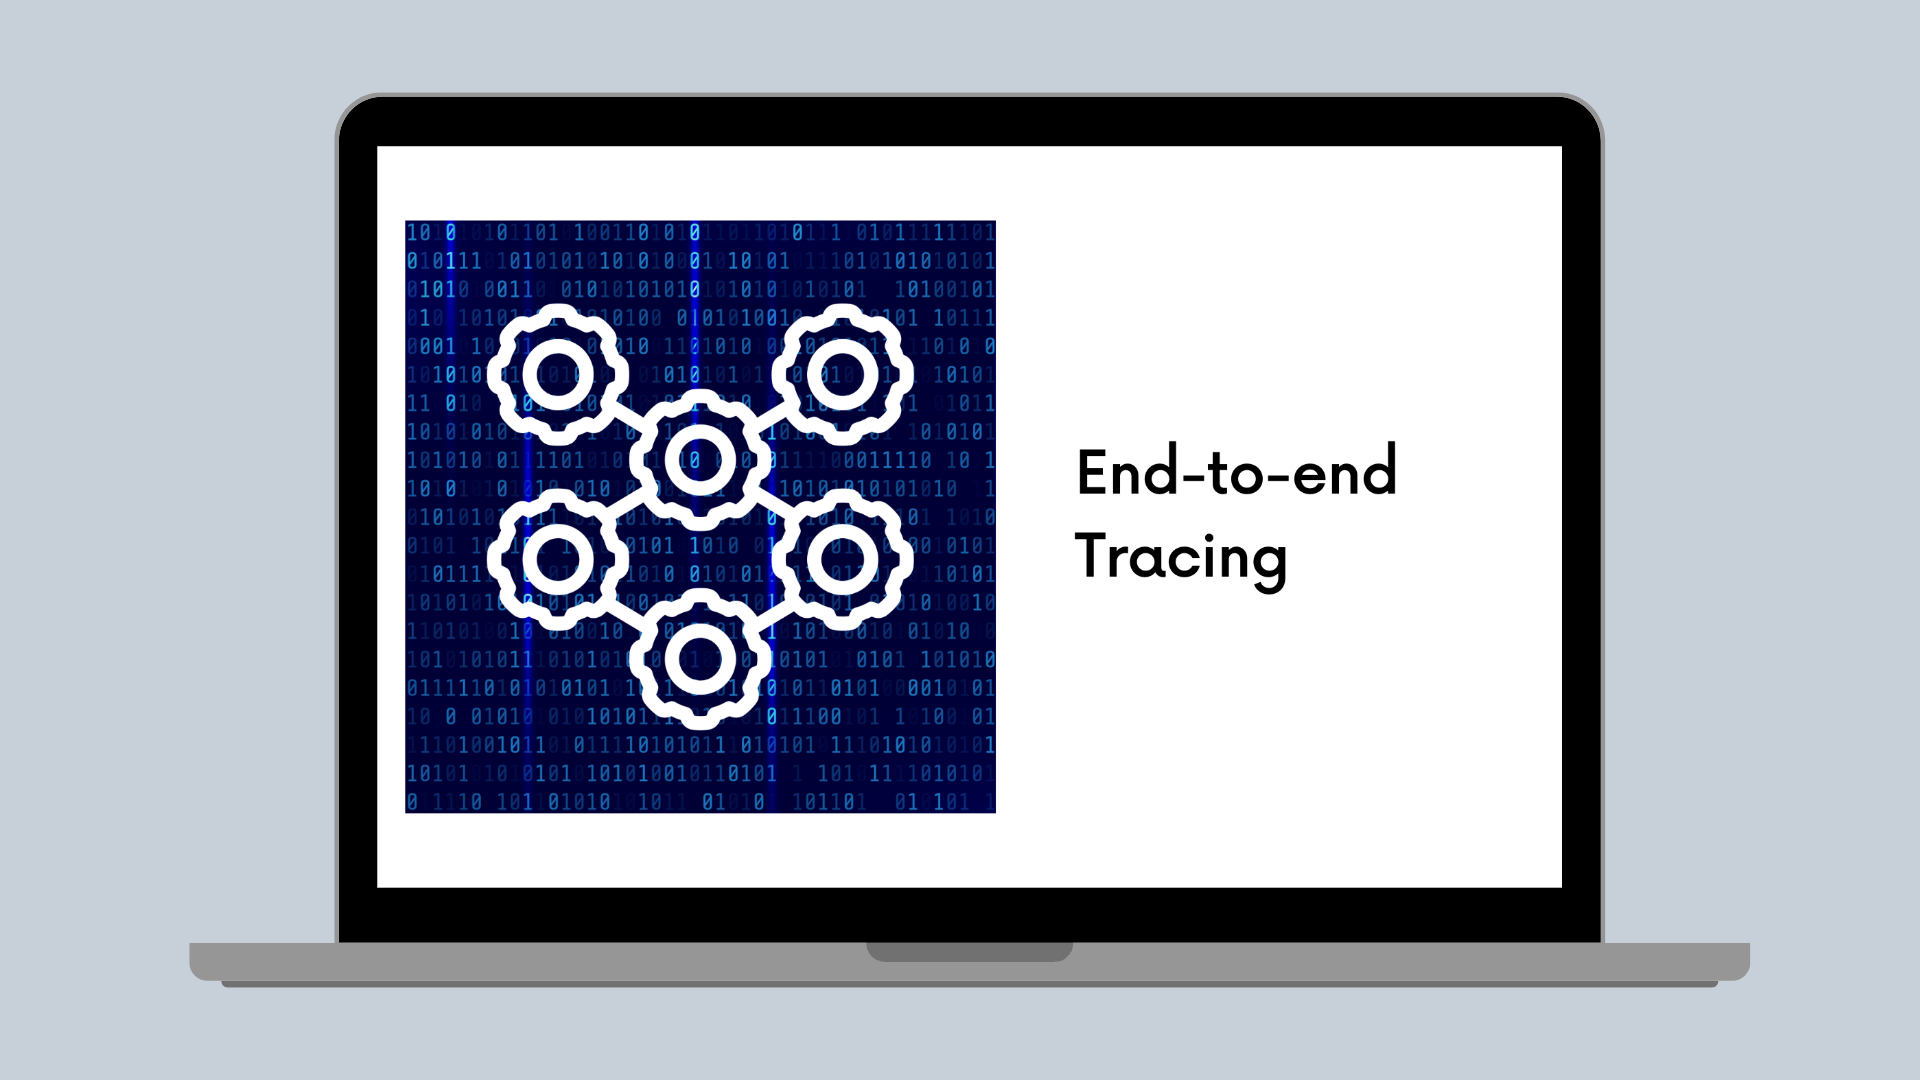
Distributed Tracing
End-to-end Tracing
How Canva implemented end-to-end tracing and are using it to drive operational insights
Canva(opens in a new tab or window) is an online graphic design platform providing design tools and access to a vast library of ingredients for its users to create content. We have over 100M monthly active users with over 15B designs across more than 100 languages.
To guarantee the best experience for Canva users, monitoring the health of our systems and rapidly detecting issues is critical.
To assist with this, our engineers use various observability tools powered by telemetry signals such as logs, metrics, traces, and exceptions. These tools offer opportunities to pre-empt, detect, and troubleshoot incidents and can provide operational insights into how Canva's systems interact with each other.
In this post, I'll describe the history of tracing at Canva, from our beginnings with backend tracing, to introducing frontend tracing, how we combined them to achieve end-to-end tracing, and the insights that this is powering at Canva.
Tracing
Tracing telemetry signals is a crucial aspect of observability. As software systems grow increasingly complex and dynamic, monitoring and comprehending their behavior become essential for maintaining reliability and performance. Observability provides valuable insights into these systems, and tracing plays a pivotal role in capturing and analyzing telemetry signals.
Tracing enables us to track the flow of data and dependencies between services. It assists in pinpointing failures or errors occurring at specific stages of request processing, thereby streamlining troubleshooting and root cause analysis. With tracing, we can swiftly determine the origins of issues, whether in a slow database query, a failing network connection, or an overloaded microservice.
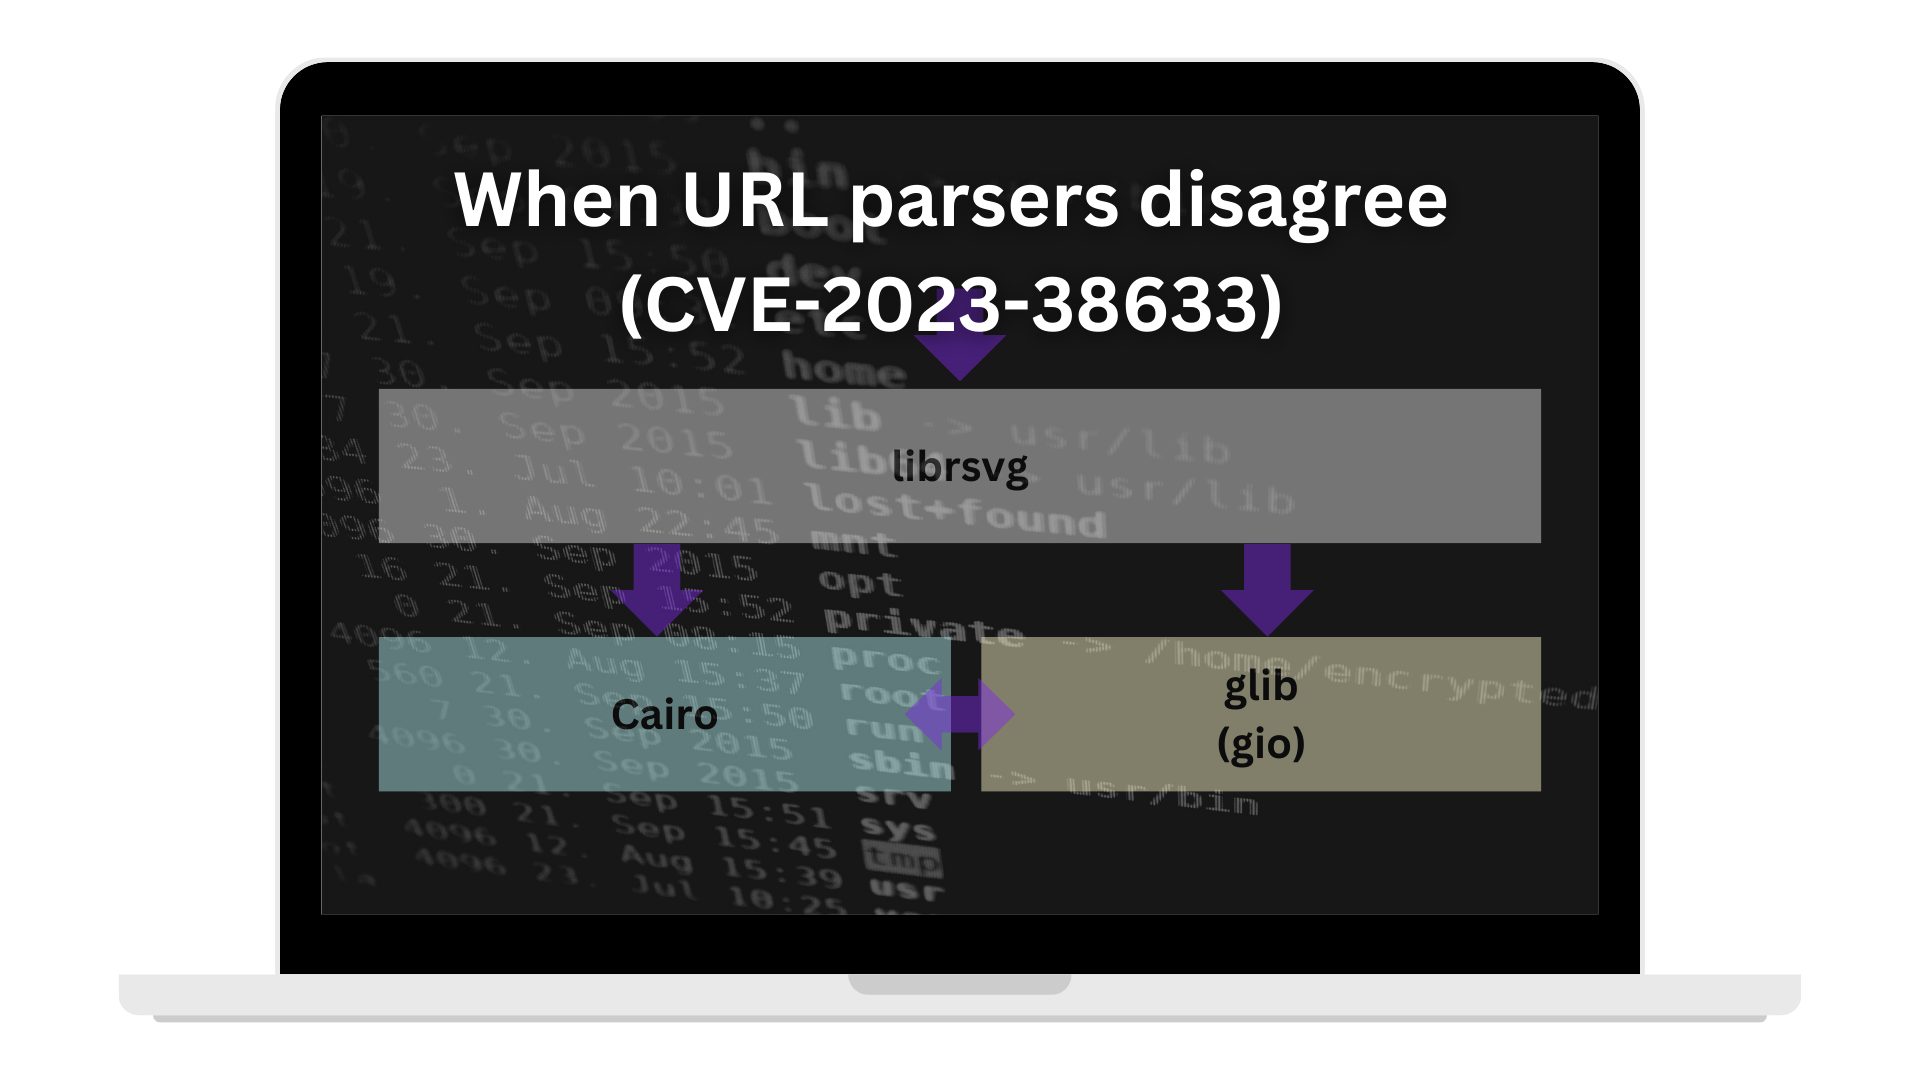
Backend Tracing
We’ve instrumented our backend services with traces since 2017. In the early days, the instrumentation of traces used the OpenTracing API, with visualization using Zipkin. After transitioning to AWS X-Ray, adoption within Canva remained low due to inflexibility with logged attributes and the retention period of this data. For example if you wanted to remove data for any reason, this necessitated blocking access to X-Ray until the retention period expired, which typically lasted for 30 days.
In Autumn 2021, the observability team decided to try other tracing tools in the market to see if we could find something to improve the user experience and the handling of data, hence improving trace adoption at Canva. To help us try different vendors, we started looking at OpenTelemetry(opens in a new tab or window) (OTEL), which, in their own words, is a collection of tools, APIs, and SDKs. It’s used to instrument, generate, collect, and export telemetry data (metrics, logs, and traces) to help analyze a system’s performance and behavior.
We decided to set up an OTEL gateway as a hackathon project. The purpose of this gateway was to transmit trace data to OTEL-compliant tools from various vendors such as AWS(opens in a new tab or window), Datadog(opens in a new tab or window), Honeycomb(opens in a new tab or window), or Jaeger(opens in a new tab or window).
This experiment would not have been possible if not for OTEL. We would have had to modify the instrumentation and collection agents in our services to accommodate each vendor's tool, which would have been daunting. However, with OTEL, we only needed to instrument our codebase once, and the gateway copied and routed the data to the appropriate vendor's tool.
As a result of this experiment, we made a well-informed decision to fully embrace OTEL in our codebase and use Jaeger as our preferred trace visualization tool. By integrating this into the fundamental framework on which we build our services on, we can provide a robust level of tracing “out of the box”, and with our system generating over 5 billion spans per day, we have a wealth of data for engineers to see how their system is performing.
We chose Jaeger as our trace visualization tool, but we also integrated trace data into our existing tools, such as Kibana and Datadog, enabling us to drive adoption by providing a user experience that matches what teams are familiar with from existing signals.
Frontend Tracing
We’ve largely solved the backend tracing problem, and it’s now a common practice with good support, and auto-instrumentation for many systems, including our Java microservices. However, frontend tracing was still a relatively new and unexplored area.
We only had exception monitoring when we first began exploring OTEL for frontend observability.. While exception monitoring is useful for identifying and diagnosing incidents, it doesn’t provide insight into the user journey or the performance of their requests. Tracing is critical for understanding dependencies and is equally relevant for frontend pages and components.
To enable tracing for Node.js or browser applications, OTEL provides a JavaScript API and SDK. Initially, we created an MVP tracing service that wrapped the OTEL SDK. However, after a thorough discovery process, we implemented our own SDK following the OTEL specification.
Bundle Size
At Canva’s scale, with over 100M active users, we want to ensure every one of those users has the best experience possible. Increasing the size of the bundle impacts the user experience, especially with users who have slower devices or slower connections, resulting in longer loading times because of downloading and processing the larger bundle, so Canva enforces strict limits on bundle size increases.
Because tracing needs to be included in the entry chunk of a page to monitor page load telemetry, every kilobyte counts. The community-provided API and SDK added 107 KB to Canva's entry bundle when we initially implemented tracing, which is comparable to the bundle size of React.
To mitigate this, we implemented our own SDK according to the OTEL specification while being uniquely tailored to Canva’s specific codebase and needs. This implementation added only 16 KB to the bundle, or 15% of the community-provided API and SDK size, primarily achieved by only implementing the specific functionality that Canva required instead of the broad functionality of the community-provided API and SDK.
Although they’ve since added tree shaking to the OTEL JavaScript library, our unique code structure, conventions, and use cases led us to still prefer our custom implementation.
Asynchronous Context Management
Many OTEL implementations, like those for Java or Golang, use thread-local storage to enable retrieval of the current span, as shown in the following example.
ctx := context.TODO()span := trace.SpanFromContext(ctx)
The absence of an asynchronous context manager in the browser means that passing a value down an asynchronous call stack is currently not possible. However, there is a proposal(opens in a new tab or window) underway to address this issue. According to the OTEL specification and the community's JavaScript implementation, if your environment lacks an asynchronous context manager, you must manage contexts by explicitly passing them.
With how our code is structured and the code styles enforced, we found that passing both the span and context was cumbersome and could cause confusion for developers, especially because the term "context" is loaded with multiple meanings. Additionally, we questioned the need for developers to understand and manage the context.
We evaluated the possibility of using OTEL's Context Zone package, which relies on Zone.js to offer comparable functionality to the Java or Golang SDKs. However, we ultimately decided against it due to concerns over its impact on bundle size (an additional 33 KB) and other performance considerations.
Therefore, we decided to deviate from the Open Telemetry specification by hiding the concept of a context from engineers. Instead, we implicitly held the context within a span, resulting in an API tailored to Canva’s needs.
export interface SpanContext {readonly traceId: string;readonly spanId: string;readonly traceFlags: number;}export interface Span {// ...readonly context: SpanContext;}
As shown, the Span object holds its own context, allowing us to simplify context passing for nested span creation.
function main() {const rootSpan = tracer.startRootSpan("main");childFn(rootSpan);}function childFn(parentSpan: Span) {const childSpan = tracer.startSpan("child", parentSpan);}
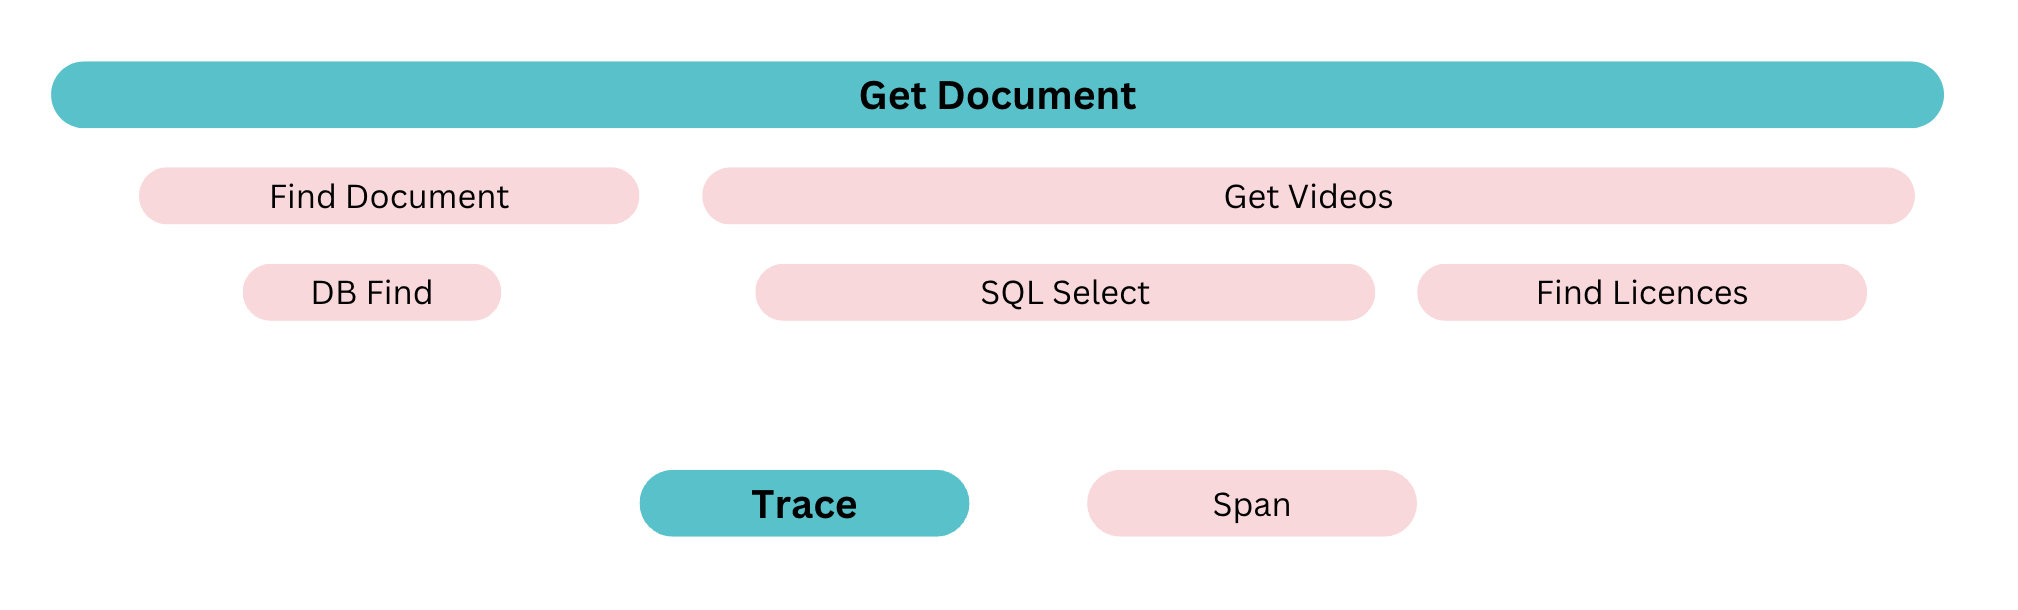
End-to-end Tracing
Having end-to-end tracing means we can track the code execution across multiple service boundaries, such as from the frontend to the backend. We needed to have a single trace that includes all frontend spans, as well as any associated backend server-generated spans, including Canva API requests.
To be able to track code execution across multiple service boundaries, including from the frontend to the backend, we use the built-in capability that OTEL provides by allowing parent spans to be incorporated into a single trace, providing trace context between services or over a network.
At Canva, our internal tooling generates the browser API services with a dependency-injected HTTP client class for making the API calls. To ensure backward compatibility and minimal impact, we developed a system allowing services to opt-in to trace context passing. This system includes an optional parameter for a parent span, which, if provided, generates the relevant spans and propagates them to the HTTP client for network propagation.
To send trace context over HTTP, we use the W3C Trace Context header(opens in a new tab or window). In our backend services, we check for this header and, if present, build a context using it or a root context if not.
Deriving Insights from Trace Data
When we originally implemented end-to-end tracing at Canva, we did so for the value that code execution tracking would provide, being able to see bottlenecks, inefficiencies, and so on, but we now realize that trace data and associated tools will increasingly drive our operational insights in the future. Insights such as analyzing the costs of services and components, detecting incidents, responding to them, and assessing their impact. By leveraging these insights, we can continuously improve our systems and provide a better experience for our users.
User-perceived Reliability
Reliability is typically measured based on system or component performance metrics, such as latency and success rate. However, these measures might not accurately reflect a user's experience. To address this, we’re developing a new reliability measurement that considers the user's perception of the system.
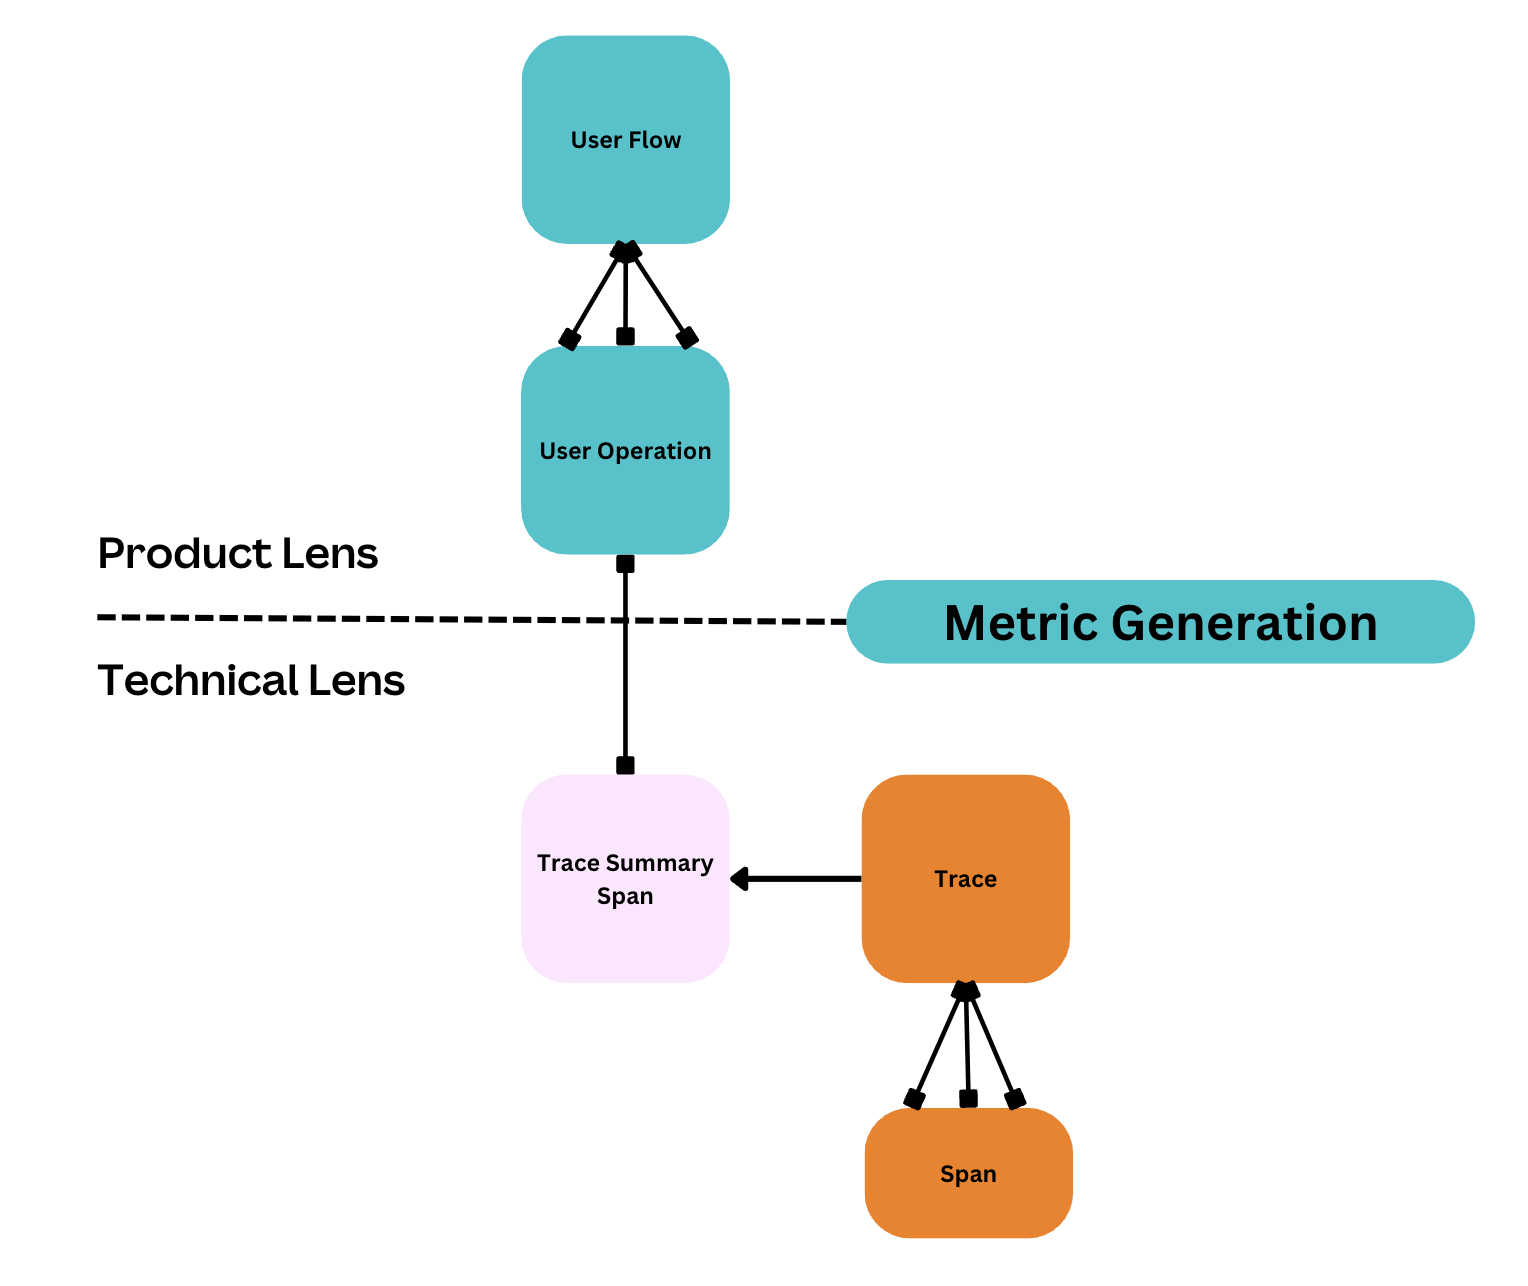
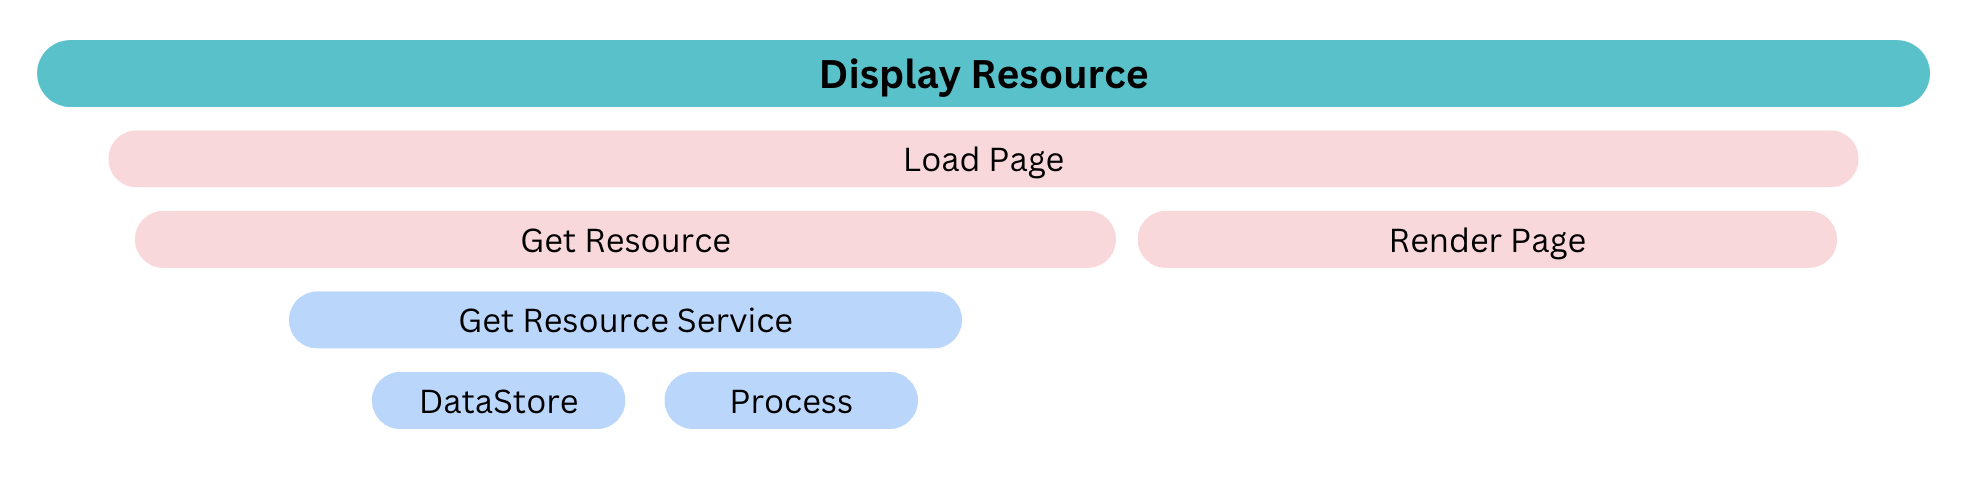
We use trace data to create metrics for user flows and user operations. A user flow is a specific feature involving multiple technical steps, such as sharing a design through link sharing. We refer to these steps as user operations, including anything from a button click to a network request.
Our main problem with this project has been the large amount of data. Although we sample only 5% of trace data, this still results in 5 billion spans daily that our telemetry platform processes. The challenge is that we require all the data to obtain accurate measurements. How can we achieve this without moving to 100% sampling?
To solve this issue, we developed a plugin to identify user operations by analyzing a span attribute. When detected, the plugin records the span and all nested children, aggregates them into a summary span, and sends it 100% of the time before sampling occurs. Metric generation then occurs in a custom processor deployed as part of our trace data ingestion pipeline.
This is just a glimpse of the ongoing project work. We plan to share our progress in a future blog post, covering our efforts in our frontends, backends, and telemetry platform and how we report these metrics.
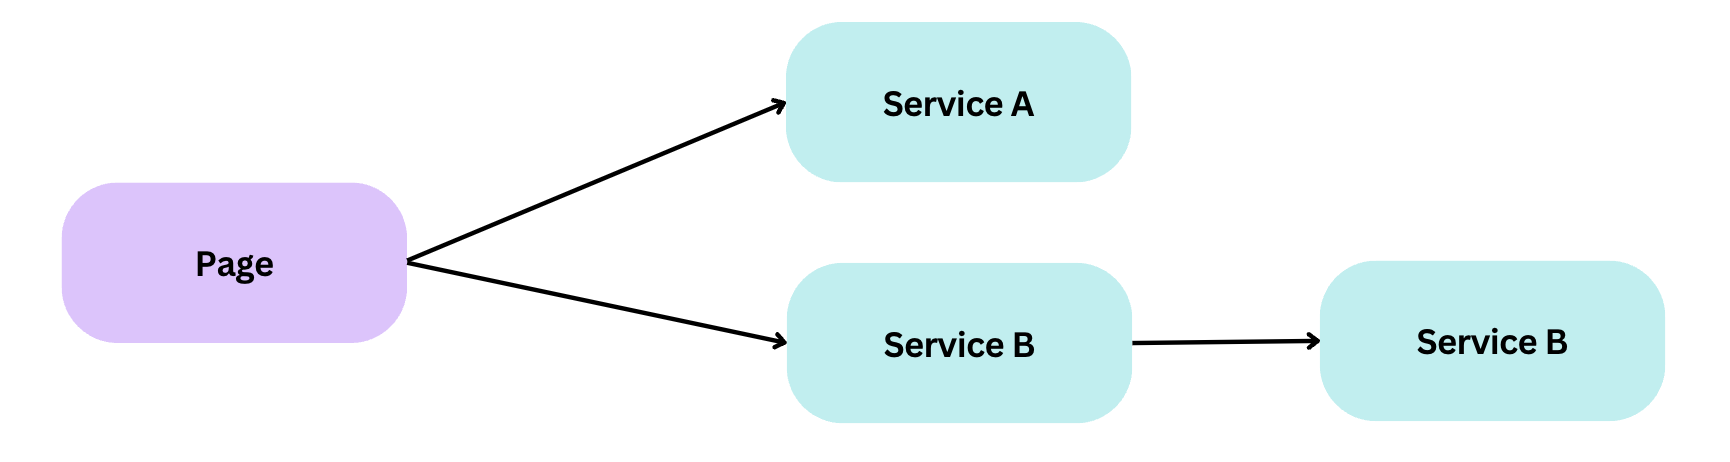
Service Graphs
A service graph is a graphical representation of a system's services and their relationships. Each node in the graph represents a service, while the edges represent the operations performed between them.
Our team found that existing service graph solutions available in the market didn’t meet our highly specialized needs, or they provided a lot of features we didn’t need, so we decided to build our own.
Trace data will power our solution and automatically determine the services and their relationships, both frontend and backend, from the trace data. We generate the service graph in real time from trace data, avoiding the need to maintain definitions.
As we maintain and own our telemetry collection and processing platform, we can derive important metrics such as request per second, latency, and success rate from the user perspective, populating the visualization with key information for engineers to check the health of the service in real time.
Conclusion
Tracing is an extremely effective tool, especially when integrating with frontends and tracing end to end. Tracing provides visibility into code execution that delivers impact through visualization and as a data source for deriving metrics. Using trace data visualized in Jaeger, some of our teams have optimized how to make their API calls, adding parallelization, which has reduced load time on some actions by 50% - or up to 1 second.
As shown in previous sections, we can also use trace data to drive operational insights. We plan to collaborate with other teams and use trace data for even more usages, for example, calculating a feature’s financial cost, risk analysis of dependencies, SLO validation, and many more.
Tracing at Canva is here to stay, and will power decision-making and incident response for years to come.
Acknowledgements
A huge thank you to the following people for their contributions to tracing at Canva:
Pranavi Chandramohan(opens in a new tab or window), Taj Pereira(opens in a new tab or window), Bohdan Lytvynov(opens in a new tab or window), Foad Nosrati Habibi(opens in a new tab or window), Zjan Turla(opens in a new tab or window), Abdullah Siddiqui(opens in a new tab or window)
Interested in building tools to provide operational insight? Join Us!(opens in a new tab or window)