Security
Endpoint vulnerability management at scale
How we do endpoint vulnerability management at Canva.
Canva(opens in a new tab or window) has a mission to be the world’s most trusted platform. To earn and keep customers' trust, we implement a wide spectrum of mechanisms and systems to minimize the likelihood that malicious actors will gain access to our systems and to data belonging to our customers. Generally, we focus on protecting public-facing systems like the Canva product and the infrastructure that supports it. However, we also work to protect systems people might abuse to access that infrastructure, specifically laptops issued to Canva employees. As an example, LastPass was impacted in 2022(opens in a new tab or window) when threat actors compromised a vulnerable and unpatched application in a laptop belonging to one of their employees. The threat actors then used keylogging software to obtain credentials to access other corporate systems.
This problem seems easy to solve in isolation – there was a patch for the vulnerability someone should have applied. However, there are complexities when you try to solve this problem at scale. Different websites host each application’s installer, and users might not know what's out of date and might not see updating as a priority. Updating takes time users could spend doing valuable work, or data on installed applications might not be readily available. At Canva, we've implemented processes and systems to help us tackle this issue at scale. Our endpoint fleet comprises over 5000 devices deployed across numerous countries worldwide. We couldn’t find anything that did everything we wanted, so we put a few pieces together and built a system interacting with multiple vendor products. This blog post explains how it works.
Define SLAs and responsibilities
Before implementing a solution, it's important to outline who is responsible for what and what timeframes the teams involved will work towards when resolving issues. We engage the teams involved and define the timeframes collaboratively instead of dictating them. At Canva, our security team is responsible for finding and reporting vulnerabilities, and our IT team resolves these vulnerabilities across our endpoint fleet. These teams have a good working relationship, so we're not making one team solely liable for a step of the process. Instead, we define who leads each step while the other provides support.
When we’ve set responsibilities, we define Service Level Agreements (SLAs). SLAs are important for prioritization and accountability. Defining SLAs is not an exact science and depends on perceived urgency and capacity. We are an Australian company, so we base our SLAs on the Patching Applications and Operating Systems(opens in a new tab or window) article by the Australian Signals Directorate's Australian Cyber Security Centre(opens in a new tab or window). Keep in mind that SLAs should be open to review. When introducing a new process, we start with generous SLAs, allowing teams to adjust and making them more strict as they improve their work. We split SLAs based on the severity of the vulnerability: low, medium, high, or critical.
Data flow visualization
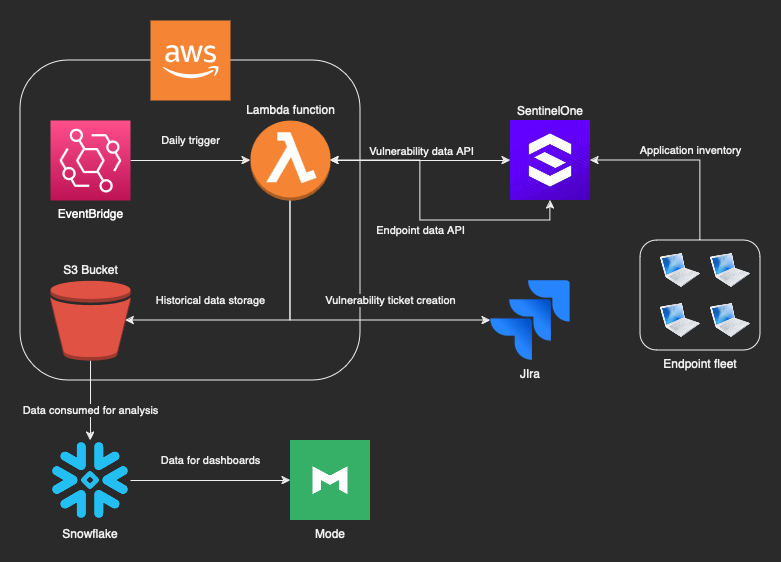
The following diagram illustrates how data flows through our systems. Don’t worry if it seems a bit complex. We’ll dive deeper into the different parts as we go through the article.
Get application and vulnerability data
Data helps us determine the problem’s scope and measure whether our approach is working. To obtain application data, we rely on SentinelOne, our Endpoint Detection and Response (EDR) solution. The EDR agent has a module that takes inventory of all applications installed on all endpoints in the fleet. It aggregates that data, making it viewable on the console and available to query through APIs. Among the data points gathered by the EDR, we get the application name, device identifier, application version, and application vendor. When we upload this data to the console, our EDR vendor assigns vulnerabilities to each application-version combination. We then get the following additional data points through the console or the API: assigned Common Vulnerabilities and Exposures (CVE) ID, Common Vulnerability Scoring System (CVSS) score, date detected, and date last seen.
There are other ways to get this data. You might be able to use your Mobile Device Management (MDM) solution or fleet data gathering tools to obtain the application version and name. Deploying osquery(opens in a new tab or window) (it’s free!) across your fleet opens up one access pathway to this valuable data. Armed with this information, you can cross-reference it with CVEProject(opens in a new tab or window) data to identify vulnerable applications in your fleet.
The following is an example of what a vulnerability record looks like.
{"application": "Docker 4.19.0","applicationName": "Docker","applicationVendor": "Docker Inc","applicationVersion": "4.19.0","cveId": "CVE-2023-5165","detectionDate": "2023-09-27T06:03:02.387819Z","daysDetected": 15,"endpointId": "1654713486719847187","id": "1","lastScanDate": "2024-03-31T10:42:19Z","lastScanResult": "Succeeded","nvdBaseScore": 8.80,"nvdCvssVersion": "3.1","osType": "macos","publishedDate": "2023-09-25T16:15:00Z"}
Ingest and process the data
As you can imagine, we produce a lot of vulnerability data this way. We get an individual record for each CVE on each application on each device, which rapidly leads to many records because applications might have multiple CVEs assigned (and usually, the older an application, the more vulnerabilities it has). Our thousands of endpoints typically have multiple applications installed, which can all seem overwhelming. However, if we take a step back, we only need to know a few things about vulnerable applications:
- Name and vendor.
- Which versions are vulnerable.
- The severity of the most critical vulnerability.
- Which device it’s on.
Although other details are helpful, because the way to fix vulnerabilities is usually to update, we want to know which applications to update and which endpoints they’re on.
Update applications
Making sure we keep applications up to date across the fleet is the trickiest part of all. Thankfully, our MDM lets us do this for select applications. We use our MDM to manage updates for over 70 applications (and growing). We have great coverage because most devices in our fleet use a common set of applications, but we can also manage updates for applications exclusive to some teams. And the impact on users is minimal: when an update is ready, our MDM agent notifies users with the option to update. When they click the update button, the application is closed, updated, and started again.
Unsupported applications
For applications not supported by our MDM, we rely on a statistical risk-based approach using data gathered by our EDR. We use an AWS Lambda function to query the EDR's API and pull out vulnerability information. After some aggregation, the function determines which vulnerable applications are present in a given proportion of the fleet (we set the proportion to 40% and have lowered it over time as we get better at patching) and creates tickets for our IT team to review and investigate. We prioritize the tickets based on the number of endpoints affected and the highest severity vulnerability affecting an application.
This approach could create a bottleneck because of the human review part of the process. Because of this, we work closely with our IT team to ensure they have the resources to deal with the vulnerabilities we're escalating. We only adjust the proportion slightly and slowly after reaching an agreement. The upside of this approach is that we’re notified of vulnerabilities in software we manage that surpass a defined threshold. It reassures us that our process is working. For example, when a new Chrome vulnerability is published, we expect to receive a ticket. Because Chrome is a managed application, we take no action on this ticket and expect it to be resolved automatically within a couple of days when our MDM updates the vulnerable installations.
Depending on the risk posed by these vulnerabilities, we take multiple approaches to minimize them. Although adding an affected application to our MDM's list of managed applications is our preferred option, this isn’t always possible. We can also take more manual update steps, such as deploying fleet-wide scripts or asking our users to update manually. For the most critical issues, and when there's no patch available, we can block the application while we review our options. However, we strive to minimize user impact when taking such extreme actions. To achieve this, we proactively suggest alternative applications that are updated more frequently and can serve as a replacement.
By default, we determine risk based on the CVSS score of the vulnerability with the highest value. However, in some cases, we use other sources and data points to help inform our risk assessment, such as evaluating reports from our Threat Intelligence team or when a vulnerability gets picked up by the mainstream media. At this point, vulnerabilities are usually very easy to exploit remotely with little user interaction, or there are reports of threat actors actively abusing them.
The following is what one of these tickets looks like.
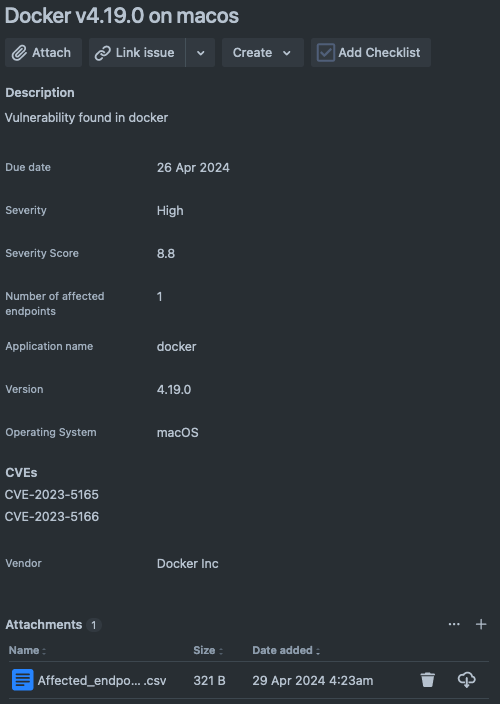
The issue due date is calculated automatically based on the CVSS severity and the SLAs defined in the standard.
Testing the process
At this point, we’re happy with how the process looks, but we’re interested in knowing whether it works. To confirm this, we grabbed a testing laptop and installed old versions of a few applications affected by specific CVEs. Among the applications we installed was Firefox version 72.0, which is susceptible to CVE-2019-17026(opens in a new tab or window). We could see the vulnerability on the EDR console after the next application scan. Our custom system also reported it in a ticket with all the right attributes. When we set up automated Firefox updates in the MDM, we also received a notification on the test laptop to update the application.
How we measure success
As well as creating tickets from the extracted vulnerability data, we deliver it to our data warehouse so that we can play with it, find patterns, and make sure things are trending in the right direction. The output looks like the following.
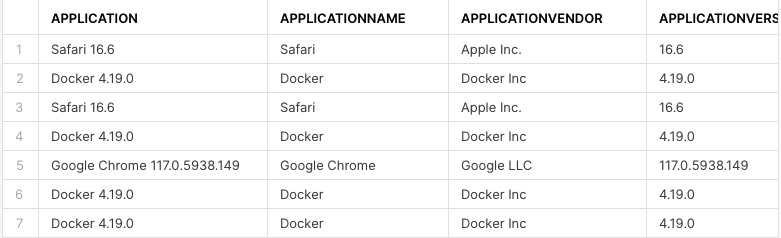
We used this data to create the views described in the following sections. Note that the data presented is not real. In some cases, the graphs might indicate issues with the vulnerability management approach. However, this is for illustrative purposes only and doesn't reflect the actual data or status of the vulnerability management process at Canva. The queries used and the sample data are available in Github(opens in a new tab or window) for viewers keen to dive deeper into the details.
Vulnerabilities over time
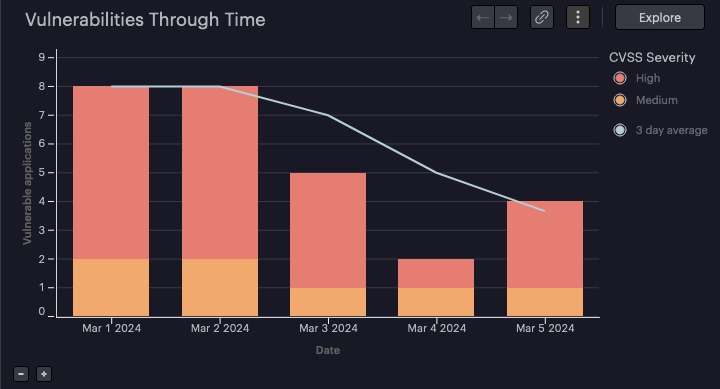
This graph shows whether our methods to reduce vulnerabilities work. What’s interesting about this and other similar graphs is that they trend up. With time, more vulnerabilities in applications are discovered and published, so taking no action means that the number of vulnerabilities naturally increases.
The graph shows the number of vulnerabilities reported daily and at which severity level. Ideally, the bars should go down if patching is working. If they stay steady, we’re likely not addressing some vulnerabilities. We expect steep increases when vulnerabilities affecting most of the fleet are newly reported, for example, when there's a new OS or browser security update.
Vulnerability data likely fluctuates daily depending on the number of endpoints and applications in your fleet. This is especially true when you apply a patch that solves multiple vulnerabilities or a new set of vulnerabilities is published. Using the average number of vulnerable applications helps gain insight into how the number of vulnerabilities trends over time, smoothing out those fluctuations.
Top widespread vulnerable applications
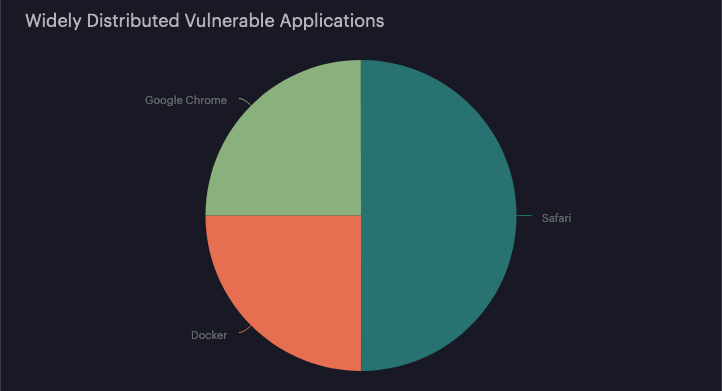
With this view, it’s easy to visualize if a set of applications, in particular, introduces the most risk to the organization. It can help prioritize efforts into which applications to manage. It shows only a snapshot of the latest vulnerability scanning report. It’s especially useful when significant changes are visible in the graph shown in the previous section to see the most likely applications that caused those changes.
Vulnerability age through time
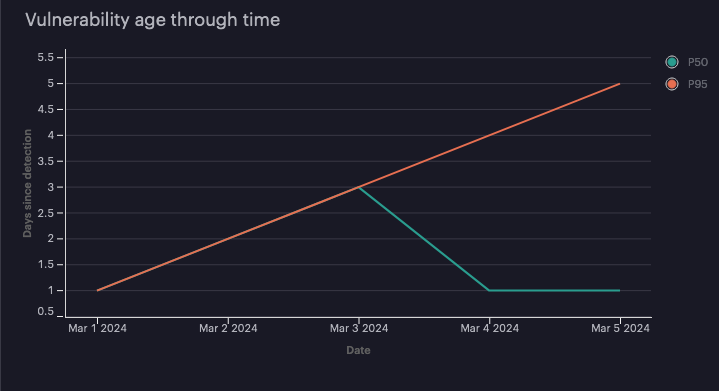
The view provides interesting data about the vulnerability age in the environment. The graph tends to climb steadily because vulnerabilities become a day older each day, but it can give you some insights into how old the unaddressed vulnerabilities are.
We use percentiles in this graph and intentionally avoid averages because they can be misleading. If you have a low average, it could be because you’re resolving most vulnerabilities quickly with a few old vulnerabilities remaining in the environment for too long. Percentiles provide better context because they help us infer the data distribution. The previous graph shows us that, on March 5, around half of the vulnerabilities were one day old or newer, and half were a day old or older, as indicated by the P50 line. From this, we infer that half the vulnerabilities are very recent, and a good volume of vulnerabilities are getting resolved. The graph also tells us that at least one of the vulnerabilities has remained unresolved for multiple days, as indicated by the P95 line. At least 5% of reported vulnerabilities are five days old on the 5th day we measured vulnerability age. From this, we can determine that patching is working in most cases, but at least one vulnerability seems persistent. In bigger datasets, it's also useful to use additional percentile values and graph the maximum vulnerability age value for comparison.
Widespread managed vulnerable applications out of SLA
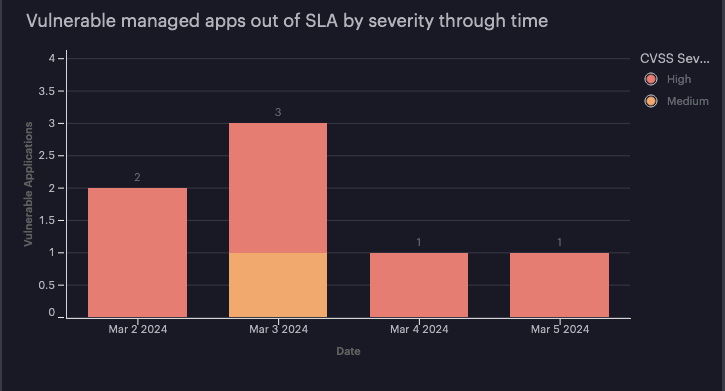
This view is what we've found most impactful at Canva. It’s more complex than previous views, using an external table to determine which applications we centrally manage.
Ideally, this graph should only show spikes. Similar to the first graph, whenever a vulnerability is published, it’s visible in this report before we patch it. When the vendor releases an update and we apply it, the numbers should rapidly decrease. If the numbers are sustained over time, we’re not resolving vulnerabilities, which can be for multiple reasons. There might be no patch available, the update process might not work as expected, or the patch might introduce new vulnerabilities.
Issues along the way
Getting to a good level of maturity wasn't always straightforward. The following are some of the issues we ran into along the way:
- Patching issues: We had to do a lot of experimenting to make sure automated patching worked well. Before we moved to patching everything through MDM, we also used some vendor-supplied patching tools. Of particular note was that we had difficulties with Microsoft Teams. Even though we had it set up correctly and it wasn’t reporting issues, we found through our dashboards that updates weren’t being installed.
- Software quirks: Our EDR has some application visibility issues where it only considers applications installed if they meet specific criteria, like being indexed by Spotlight, not just if they're present on disk. Our ability to enforce automatic updates in some cases was affected because our MDM expected applications to be in standard locations, so, for example, users running an application from the
~/Downloadsfolder wouldn’t receive updates. - Stale inventory: By default, our EDR only takes inventory of applications once a week. This introduces some lag to the system when an application is patched but reported as vulnerable for up to seven days. We worked around this by automatically triggering an inventory refresh daily through the API.
- False positives: Our fleet consists mainly of macOS devices. A few times, we received false reports of vulnerabilities in software that only affected Windows endpoints. This was because the vulnerability reports we get only consider the application and version, not the OS. When we initially built the aggregation and reporting system, we added functionality to add exceptions, which helped us move quickly to remove false positives. Unfortunately, we haven't yet found a good way to automate this.
Future work
While the work described previously goes a long way to reduce risk, it doesn’t eliminate it. The following sections describe some avenues we're looking to explore. We also intend to follow and apply the Essential Eight Maturity Model(opens in a new tab or window) as a formal framework to improve on our vulnerability management program.
Use exploitability during vulnerability assessment
The methods we use to prioritize vulnerability resolution are somewhat rigid and lack context that can be very useful. The CVSS framework considers how easy or difficult it is to exploit a vulnerability and whether an official patch is available. However, the output we receive through our tools is a score with no nuance. We want to consider whether an exploit is publicly available for each vulnerability and whether threat actors are actively abusing the vulnerability. We can then use this information to supplement our prioritization efforts and work first on the vulnerabilities most at risk of being abused. The Cybersecurity and Infrastructure Security Agency(opens in a new tab or window) in the US provides the Known Exploited Vulnerabilities Catalog(opens in a new tab or window), which we can use for this work.
Use vulnerability data in posture assessments
If a device has applications with high-severity vulnerabilities for which patches are available, we want the user to apply those patches before trying to access sensitive data. To motivate the user to do so, we can add a check requiring devices attempting to access sensitive data and applications to be up to date.
User notifications
Currently, any user interested in learning about vulnerabilities in their devices can run a report so that they can then take action and update as required. An alternative is to send messages to users indicating that their applications are vulnerable and that they should be updated. This approach requires lots of fine-tuning because we want to avoid annoying users and having them ignore the notifications.
Conclusion
As a rapidly growing company, it is essential to address vulnerability management in a scalable way. We wanted to improve the security of our endpoint fleet while minimizing the impact on our employees. Our work in this area has also provided us with some added benefits. When there is a high-severity vulnerability published affecting a popular library or application (like the recent vulnerability in libwebp, CVE-2023-4863(opens in a new tab or window)) we’re better prepared to understand where the vulnerability is in our environment, how fast we can patch it, and whether we need to take other actions such as blocking the application or applying some other controls before an update is available.
If you're looking to implement a similar vulnerability management solution by yourself, you can do that with freely available tools or with the help of some vendors. Here are the main takeaways:
- Expect to put some effort into building. Even with vendor support, finding a solution that does it all is hard, so you'll likely have to build something to connect the different products.
- A document with defined SLAs is a great way to align expectations with stakeholders.
- Centrally managed applications and updates are critical to minimize the prevalence of fleet-wide vulnerabilities at scale. Remember that you want to address issues at the fleet-wide level and be mindful of focusing too much on a single application or vulnerability. Consider whether the effort you're putting into it is worthwhile.
- Keep the user experience in mind. Our approach is to inform users and provide them the option to update by clicking a button. The update is forced if a user doesn’t update within a set period. This approach allows users to choose a convenient time for updates, reducing overhead and streamlining the process.
- Set a limited scope; don’t try to resolve all the vulnerabilities on all the applications. There are almost an unlimited number of applications and vulnerabilities. By limiting the scope of your endpoint vulnerability management program, you can effectively remove some risk and iterate on the approach. Later, you can increase the scope as the program becomes more effective and you feel more comfortable.
- Out-of-scope items might require a different approach. It's unlikely that a single approach or solution would work here, so you can think about other things to do while you focus on the in-scope items.
- Use the data! Regularly reviewing the data is critical to ensuring the solution works and pointing out cases you need to look at. You can make this easy by building dashboards.