Performance
Behind the draw - How Canva's drawing tool works
Some of the engineering challenges we encountered while developing our vector drawing tool
At Canva, we’re on a mission to empower the world to design. Every one of us plays a key part in this mission, and from our users, we learned how important it was for them to be able to draw, write notes, and doodle on their designs. We’ve set a goal to make sure they can do this anytime, anywhere, on any device using our editor.
The target presented a unique set of challenges that pushed us to delve deeper into the intricacies of software drawing tools, which have a long and important history. These apps, along with text editors, have been around for a long time and were some of the first used on computers. It's an exciting journey to navigate through such a dynamic field, where every challenge is an opportunity for innovation.
In this blog post, we'd like to share some of the engineering challenges we encountered while developing our own drawing tool(opens in a new tab or window). We cover topics such as our state machine, techniques for squeezing a few extra bytes off SVG paths, and performance optimizations we've implemented to make a smooth drawing experience. We hope you find this post enjoyable and discover some useful insights into the development of drawing applications.
The technical journey
Events and States
At Canva, we heavily use Dependency Injection(opens in a new tab or window) (DI) and Store-Presenter-Component (SPC) patterns, which represent a structured approach for managing state and logic in applications, similar to the Model-View-ViewModel(opens in a new tab or window) (MVVM) pattern. In SPC, stores hold the state, presenters handle logic without directly modifying the view, and components display the UI without the awareness of stores or presenters. Factories tie these elements together. In SPC, presenters modify only stores, indirectly triggering view updates, which fits in well with React and Mobx.
Both DI and SPC techniques are well-suited to our drawing tool, enabling a clear separation of concerns among different classes and making code unit testing easier. We ended up with a very clear structure: the drawing factory function receives all dependencies and initializes the necessary instances of classes and components. We can divide the structure into the following layers:
- The DOM events layer, where we have the drawing overlay React component and where we add all event listeners for pointer events and pointer capture.
- The Dispatch layer processing events, where pointer handlers add additional logic, such as a touch slop check (to distinguish if a touch is a deliberate gesture or rather an unintentional one), and dispatch the events to the state machine(opens in a new tab or window).
- The Application layer, where we implement all paint tools along with logic for Preview (displaying a stroke) and Commit (adding a stroke to a design).
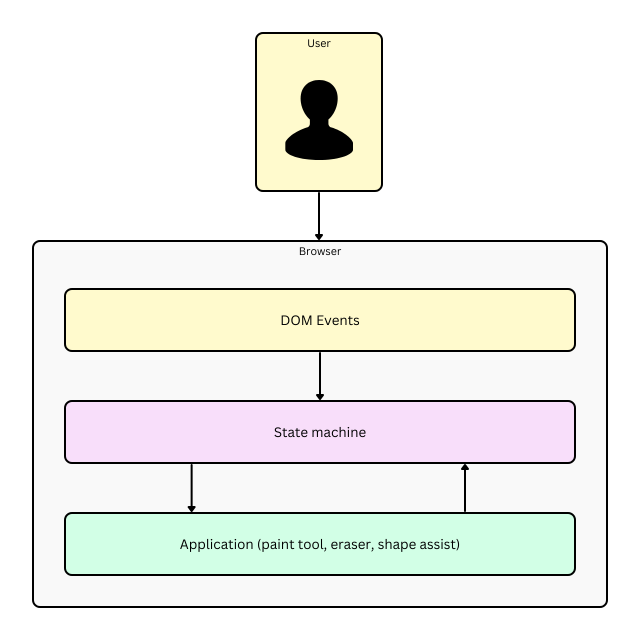
Why use a state machine? The finite state machine is a deterministic and well-established pattern for managing complex sequences of events. By building a state machine, we can guarantee proper event dispatch, accurate state transitions, and explicit behavior, all while maintaining testability and predictability. State machines encourage a modular design approach, where adding new features or tools can be as straightforward as defining new states and transitions. This modularization helps in keeping the application logic clear and separated, facilitating easier maintenance and scalability. The state machine ensures that the drawing app state remains valid, reducing the risk of errors that could lead to inconsistent behaviors or corrupt the sketch. Additionally, state machines fit well with event-driven architectures, making them an ideal choice for managing complexity in sophisticated drawing applications.
The previous diagram conceptually depicts our simplified state machine, showing its states, events, and transitions. An event is what causes a state machine to transition from its current state to its next state. As you can see, there are many transitions, which can be challenging to keep track of and manage in the code without a specific method to monitor all interactions. By implementing our own state machine, we not only obtained a clear visual representation of all possible states and transitions but also achieved predictable behavior. Thus, we even discovered several problems that were not obvious at first and were difficult to identify.
Performance challenges
Vector and raster are two primary techniques in digital graphics, each suited to different types of projects due to their inherent characteristics. Vector graphics, defined by mathematical equations, excel in creating scalable, resolution-independent images ideal for logos, illustrations, and text. Their ability to maintain clarity regardless of size changes makes them perfect for designs that need to be resized frequently or printed at various scales. Alternatively, raster graphics are made up of individual pixels, making them the go-to choice for detailed images like photographs. Raster images are best for capturing complex color gradients and subtle details but lose clarity when scaled up as the pixels become more apparent.
The choice between vector and raster depends on the project's needs. Vector is better for graphic design and applications where you need crisp, clean lines or scalable images. For these reasons, we decided to create a vector-based drawing tool. We needed a way to transform input points into visually appealing strokes. We discovered perfect-freehand(opens in a new tab or window), a fantastic library created by Steve Ruiz specifically for this purpose. It met all our use cases perfectly and could generate SVG paths in line with what we wanted, leading us to decide against developing an in-house solution. We also contributed to the project by kindly making a donation to Steve Ruiz.
The library initially generates a series of spline points from the provided input points, then creates outline points, considering additional parameters such as size, thinning, smoothing, and so on.
While vector graphics has its benefits, it doesn't come without trade-offs. We stumbled upon a few interesting performance bottlenecks:
- Using perfect-freehand led us to the situation where we had to recompute the entire stroke when a user added a new point, resulting in significant performance drops on low-end and mobile devices with long strokes.
- Strokes impacted some internal limitations, such as the maximum allowed design size.
We've decided to address each issue separately and use the pros that native platforms have to offer.
To improve the overall smoothness of user experience on mobile platforms, we built a custom native overlay to handle and buffer the input events. Because Canva mobile apps are Cordova-based, we guarantee that input points are always captured, even if the JavaScript VM is busy processing strokes.
To mitigate the issue with long strokes, we split each stroke into segments to cap the number of points that perfect-freehand has to process.
Managing the issue of maximum design size was also challenging. It involved several steps, as covered in the next section, which eventually decreased the total byte size of a stroke, thereby allowing users to include more strokes in a design without exceeding the limit.
Optimizations for SVG paths
The strokes generated by the library were pretty big and required a lot of storage. We were confident we could make improvements and set a goal to reduce the length of each SVG path while preserving the shape of each stroke and a high level of detail.
Because the SVG path is a string consisting of points and commands, we focused on reducing the number of points required to represent a stroke.
Rounding to the rescue
The most straightforward approach was to cut the point coordinate precision for the resulting path. In DOM, the raw coordinates from mouse and touch events are represented by double-precision floating point numbers, such as 383.48128125. In the SVG paths however, we determined this precision was excessive, so we rounded output coordinates to 2 decimal places, changing it to look like 383.48.
Shortening the Path
SVG commands are the alphabet of a language used to draw shapes and paths directly in your web browser. They're part of SVG (Scalable Vector Graphics), a way to create images using text-based commands that tell the browser how to construct visuals from basic shapes to complex illustrations. At the heart of creating these graphics are path commands. These commands start with letters M (move to), L (line to), C (cubic Bézier curve(opens in a new tab or window)), and Z (close path), and so on, each followed by coordinates and other parameters. For example, "M10 10" means move to the point (10,10), and "L20 20" means draw a line to the point (20,20). Cubic Bézier curves, represented by "C", are a bit more complex, allowing you to create smooth, scalable curves by specifying a few points that guide the curve's shape. By combining these commands, you can draw almost anything, from simple lines to intricate designs, all scalable to any size without losing quality.
When creating a path, we join points with the cubic Bézier curve using the absolute coordinate command C (denoted by an uppercase letter). This command might result in path segments that resemble C318.4,217.8 316.7,219 315.5,219.3. To shorten the command length, we can switch to its relative form, c (lowercase letter), which calculates coordinates based on the last position, leading to more concise expressions such as c0.2,1.2 -0.3,3.2 -1,4.2. This allowed us to decrease the average length of each stroke by approximately 32%. Additionally, we can reduce the length by using a quadratic curve q, which requires only one control point to determine the curve's slope at both the start and end points, unlike the cubic curve that needs two control points, one for the start and one for the end of the curve. This simplification can help make the path definition shorter and easier to manage.
Simplifying Complexity
However, even with these optimizations, they did not fully meet our needs. We wanted to define each stroke using the smallest number of points. To achieve this, we used the Ramer-Douglas-Peucker algorithm(opens in a new tab or window) – a technique specifically designed to simplify complex paths while preserving their main features like curvature and distinct details.
The algorithm reduces the number of points by retaining only those farther from a straight line connecting two endpoints than a given tolerance, thereby simplifying the shape while preserving its overall geometry. Tolerance, often called ε (epsilon), is a distance threshold. It determines the maximum distance a point can have from the simplified line (or shape) before you need to include it in the simplified version. This method splits the line at the farthest point if the distance exceeds the tolerance and repeats the process for each segment.
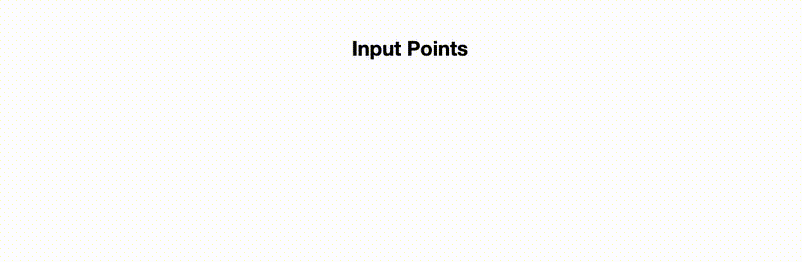
Before | After |
|---|---|
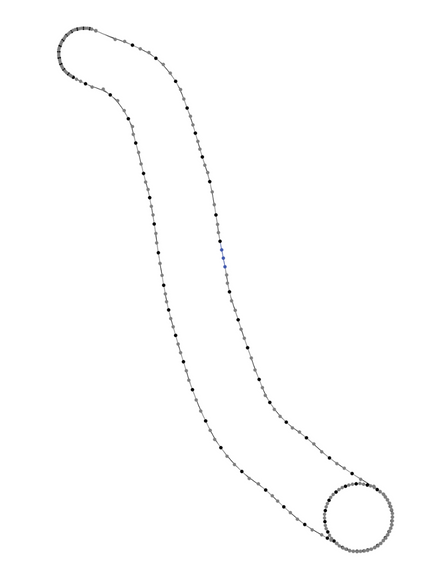 |  |
By adjusting tolerance, we can control the level of detail for the simplified version of a path. This process is also known as line simplification. The Figure above illustrates the difference between an input and a simplified curve. This approach significantly reduces the number of points, especially in areas where points lie along the same line.
Clip and shape: Refining edges
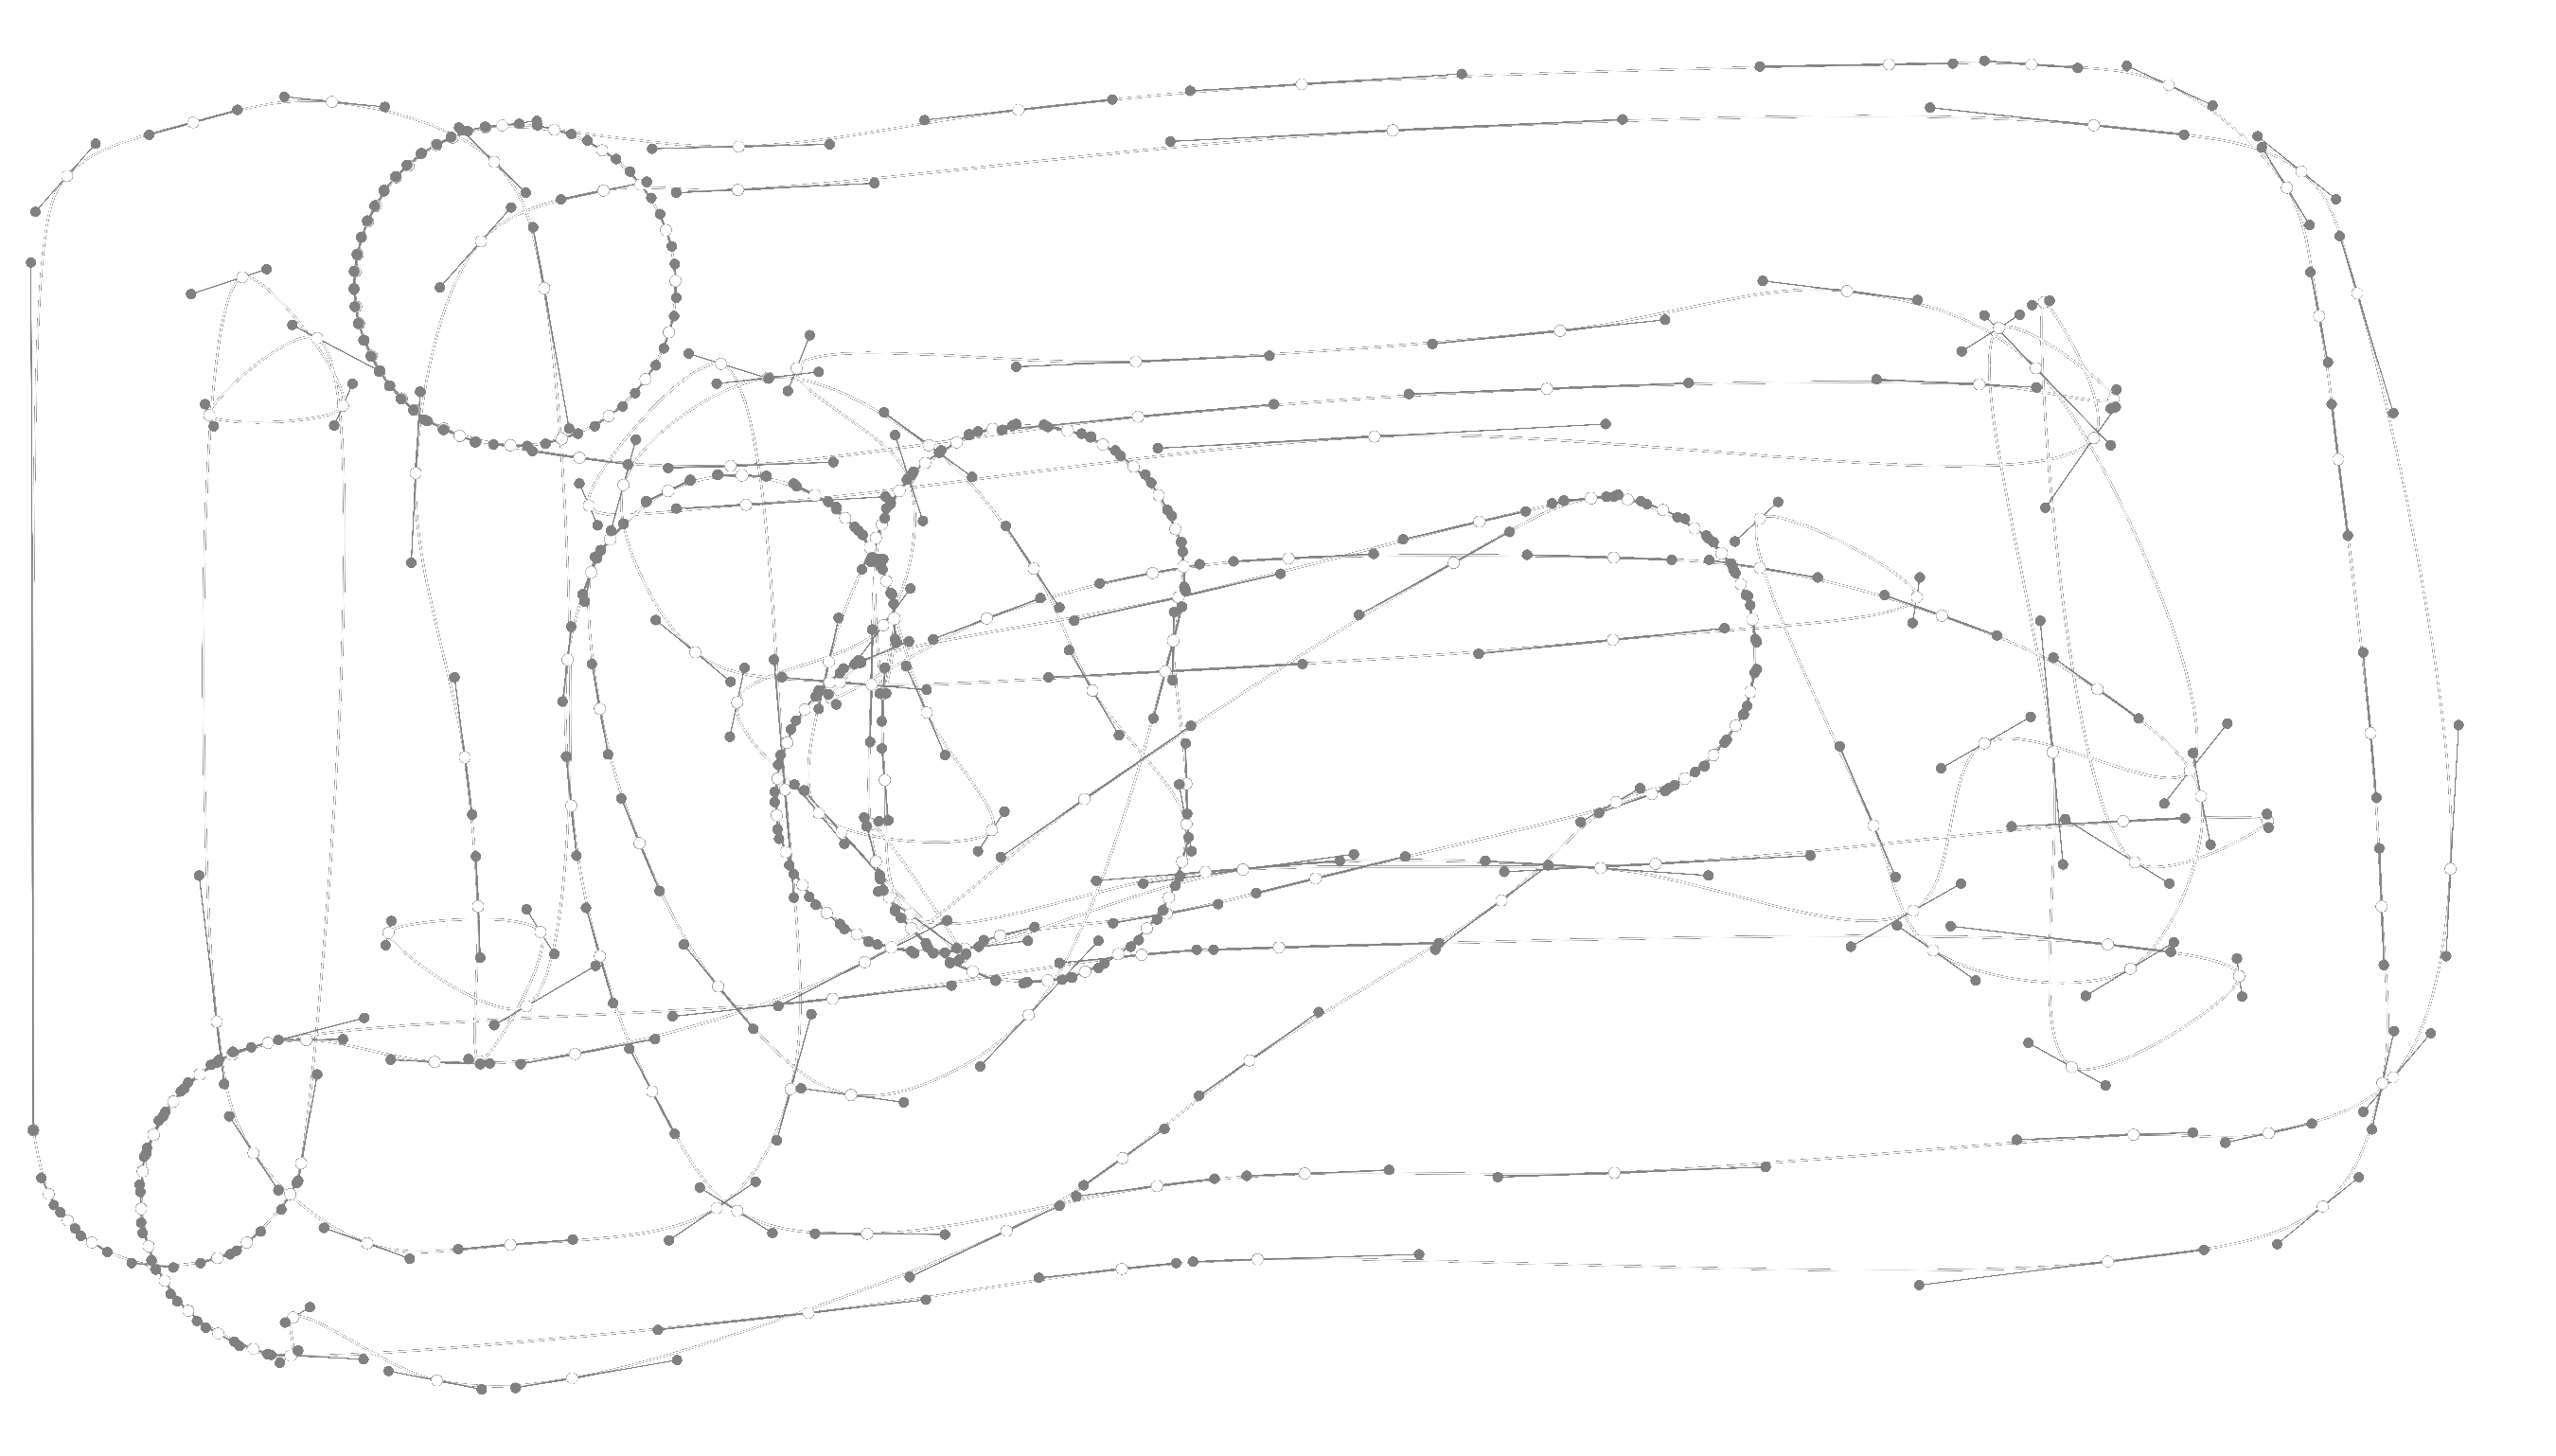
Now, paths can also cross themselves, which is known as self-crossings, where its sides or edges intersect or overlap. The following animation shows a user trying to fill an area using a marker pen, leading to many self-crossings.
From the user's perspective, this entire area consists of a fill color along with external and internal outlines that form the visible part of a stroke. However, internally, we would store it as a very long and detailed SVG path, even though storing the outline would achieve the same result.
To measure how often users attempt to fill areas, we introduced a new metric. We measured a relative area occupied by a stroke to the area of its bounding box. The data revealed that about 77% of all strokes were colored-in drawings, proving that further optimization made sense.
Because each stroke is an SVG path, and we can approximate an SVG path with a polygon, we looked for algorithms that could merge overlapping polygons into one. We shortlisted a few of them including:
- Weiler-Atherton
- Bentley-Ottman
- Greiner-Hormann
- Martinez-Rueda-Feito
Most of the algorithms couldn't handle self-crossings and degeneracies well, such as common edges or intersections located exactly at a vertex, or were limited to convex or concave polygons, or didn’t support polygons with holes. Also, some of the algorithms weren't fast enough, with performance quickly deteriorating with an increase in the number of vertices. The Martinez-Rueda-Feito algorithm, on the other hand, appeared to cover all the desired use cases.
This algorithm improves an older way called the plane sweep (or sweep line) for finding intersecting lines, first described by Preparata and Shamos in 1985. The method moves an imaginary straight line over the polygon’s area from one side to the other. It checks where this line crosses the edges of the polygon and cuts them at those points. By cutting the edges where they intersect, the method prepares the polygons for further steps.
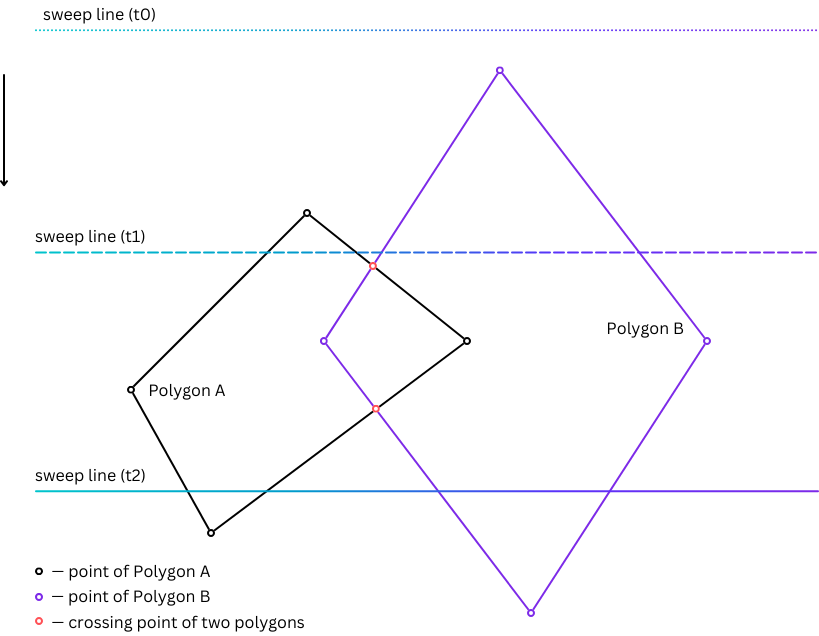
The Martinez-Rueda-Feito method works by smartly managing where lines cross and arranging the order of points using a priority queue. As it scans across the area, it keeps track of lines by adding or removing them when it sees the start or end of a line. This method makes sure it only looks at lines next to each other for crossing points, making it faster to find where lines intersect. A boolean operation, like a union, decides how the final polygons are made. It determines which lines to select based on their position to each other and how to join these edges together. This way, it can handle complex polygons, including those that overlap or cross themselves, providing a complete way to solve polygon-related problems.
Before | After |
|---|---|
 | 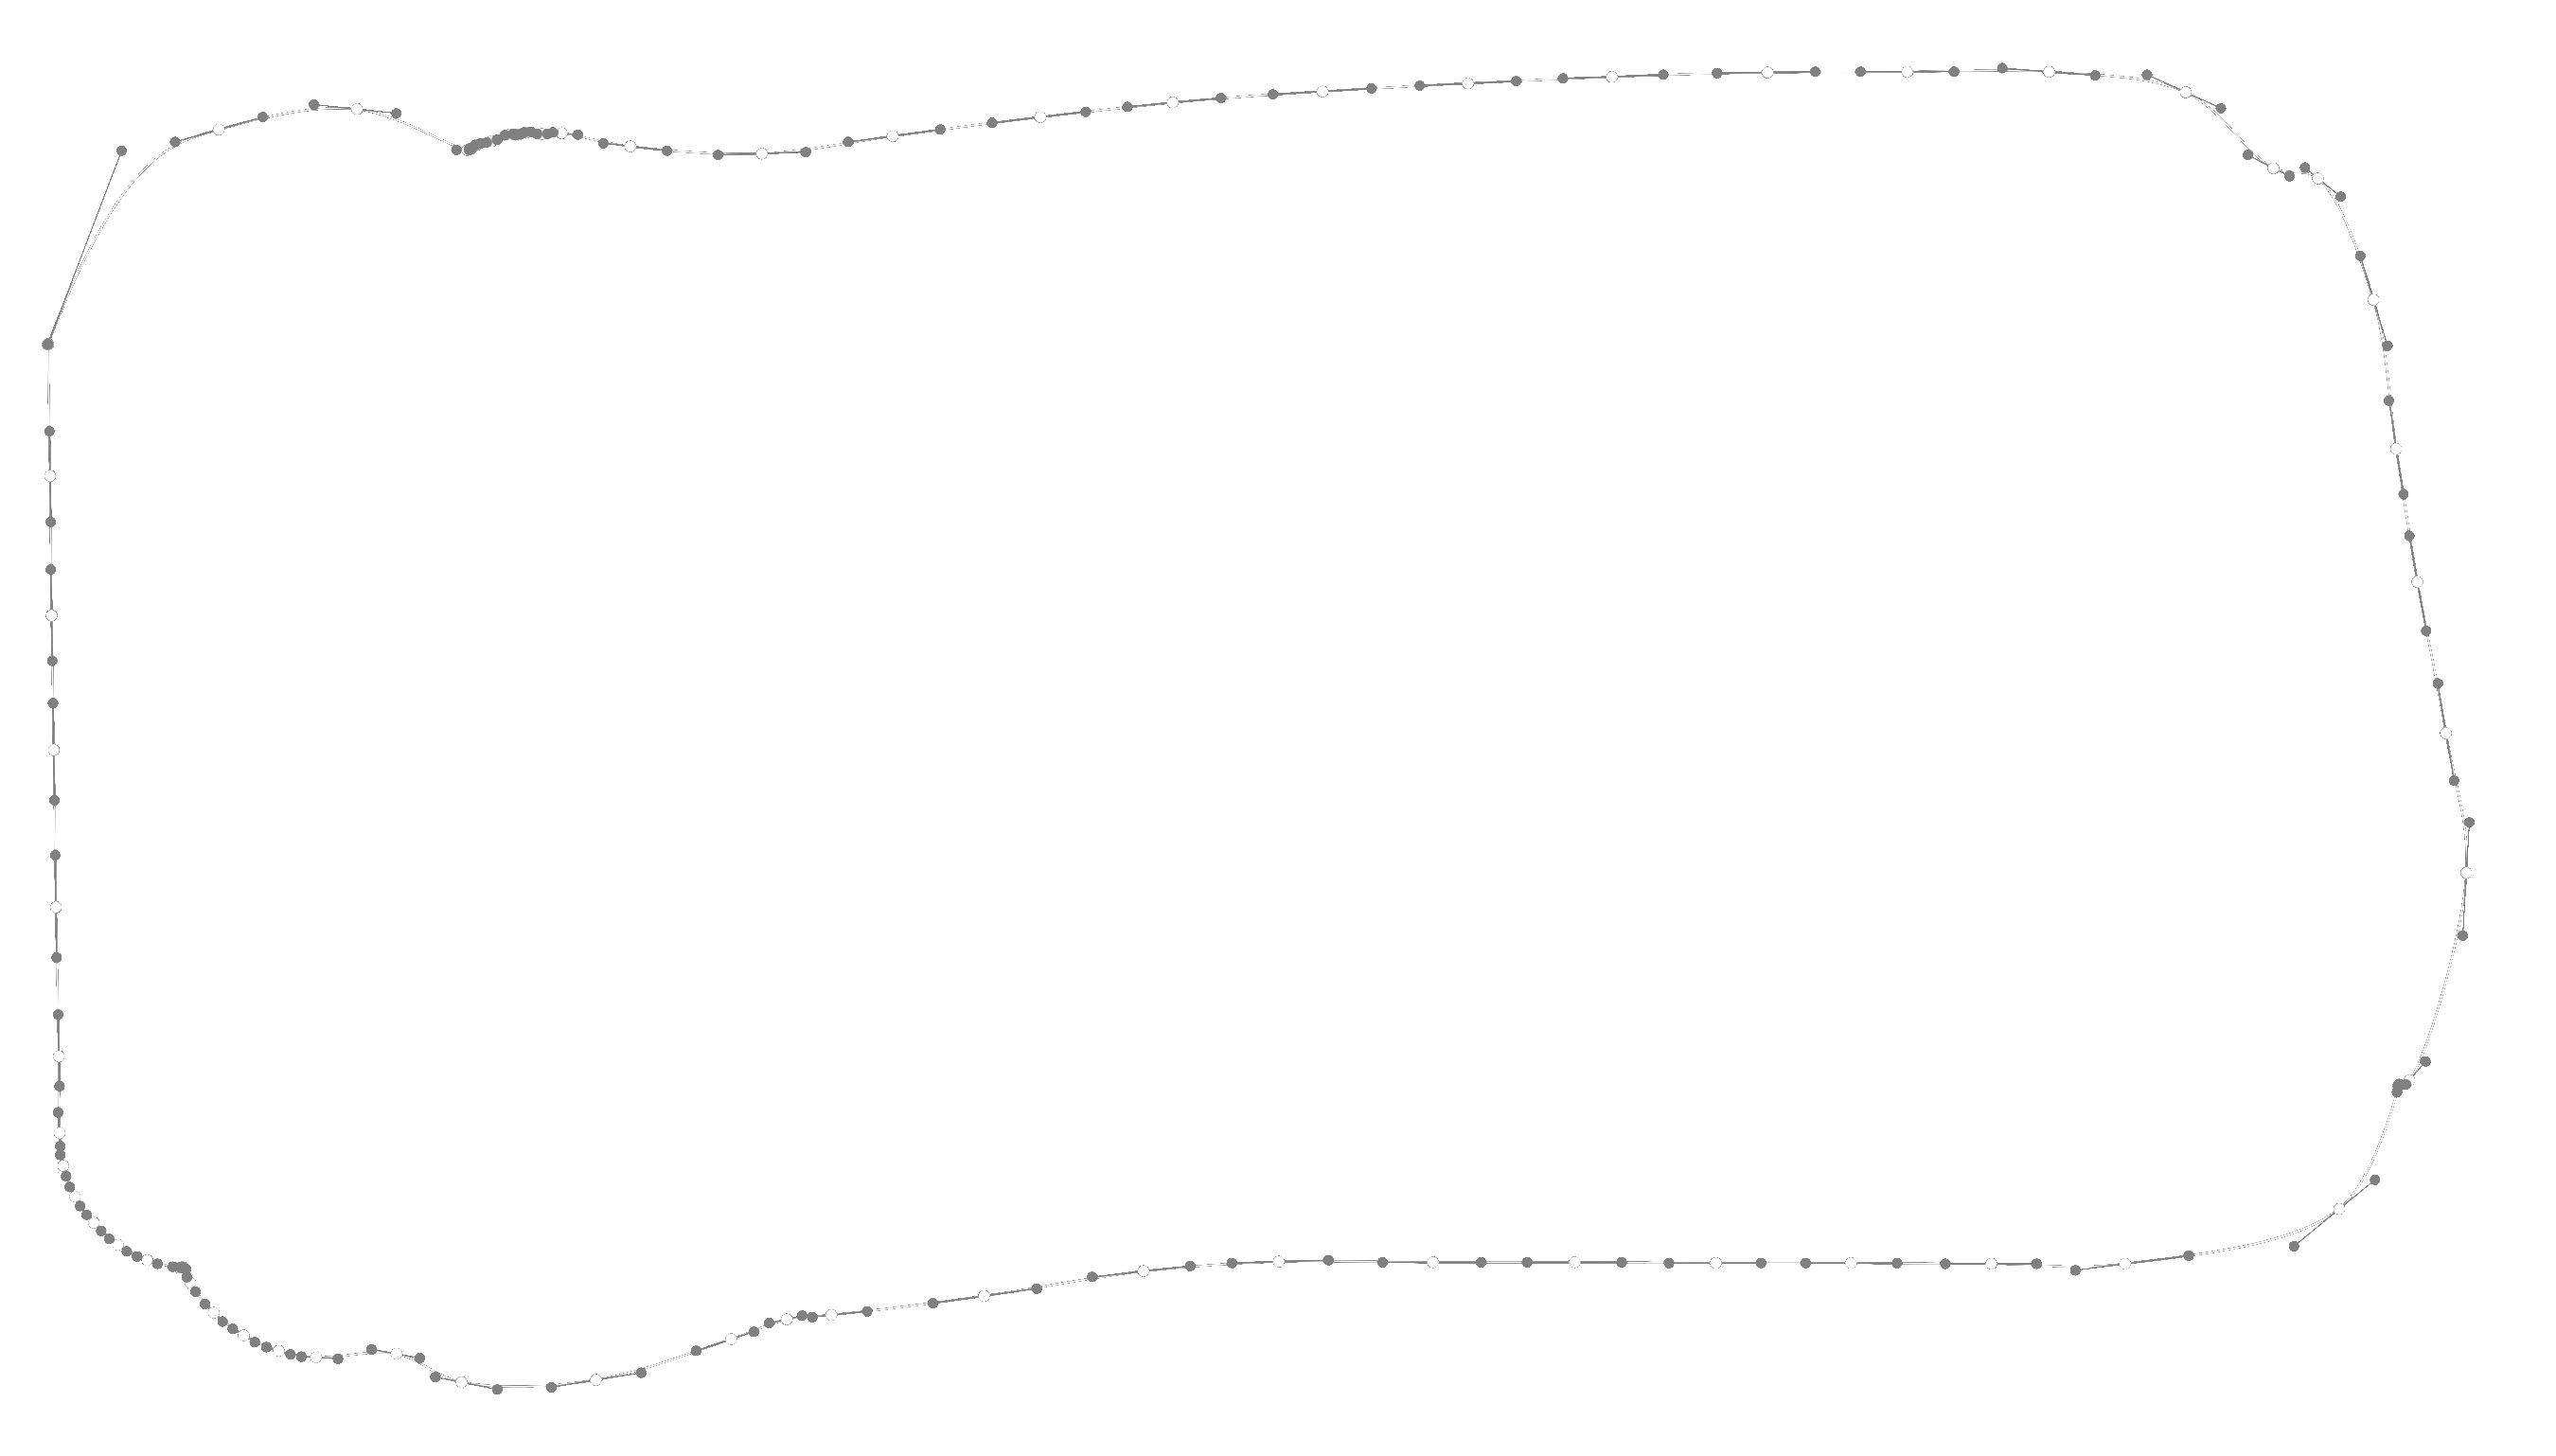 |
In the previous images, you can see the result of applying the union boolean operation on a long stroke using the Martinez-Rueda-Feito algorithm. This approach is very effective in coloring in scenarios, resulting in storing far fewer bytes.
Pushing boundaries: Shape recognition and future directions
Our work isn't limited to optimizations. One particularly fascinating and challenging area we began exploring before the big boom of chatbots was Shape Assist – a Canva feature that transforms hand-drawn shapes into neat shape elements. Initially, we began with basic computer vision techniques for simple shape recognition constrained by predefined rules. Facing challenges with complex shapes, we shifted to a more flexible ML model that learns from a vast dataset of user-drawn shapes, accommodating a wider variety of shapes and styles. The feature allows users to replace drawn shapes by holding down the cursor, with an option to keep the original shape if it doesn't match predefined classes. To learn more about how we developed our ML model, including data collection, design, training, and architecture, read the insightful post on our blog by our ML engineers, Kerry Halupka and Rowan Katekar.
And we haven't stopped here. We continue to explore and work on various AI applications in our features, some of which truly amaze us. We're optimistic about what could emerge from these explorations. We hope to bring something interesting to you in the near future. Stay tuned!
Conclusion
In this blog post, we've explored the evolution of Canva's drawing tool, highlighting our journey through technical challenges to achieve significant improvements in application performance and user satisfaction. Our efforts in optimizing SVG paths, implementing state machines, and introducing native implementations for mobile platforms have led to a more efficient, responsive drawing experience. These technical achievements not only enhance the overall usability of our application but also underscore our commitment to empowering users to design seamlessly across devices. Furthermore, our exploration into AI points towards exciting future directions for making design even more intuitive.
Building the Drawing tool has been an incredible adventure of learning, tricky optimizations, and careful research. We made it because we wanted to empower users to draw anytime, anywhere, on every device. A big thanks to our community, our highly valued users, and their feedback, for helping us shape Draw and Canva. More fun to come!
Acknowledgements
Thanks to Kevin Wu Won(opens in a new tab or window), Denis Tokarev(opens in a new tab or window), Kerry Halupka(opens in a new tab or window), Rowan Katekar(opens in a new tab or window), Shawn Li(opens in a new tab or window), Irene Yang(opens in a new tab or window) and everyone on the Whiteboards team, the Native Experience team for their work on Draw tool and Shape Assist. And thanks to Denis Tokarev(opens in a new tab or window), Vikram Goyal(opens in a new tab or window), and Grant Noble(opens in a new tab or window) for reviewing this article. Additionally, immense gratitude to all who contributed to the Canva Draw project; your support has been invaluable, and I am delighted to collaborate with each of you.