Algorithms
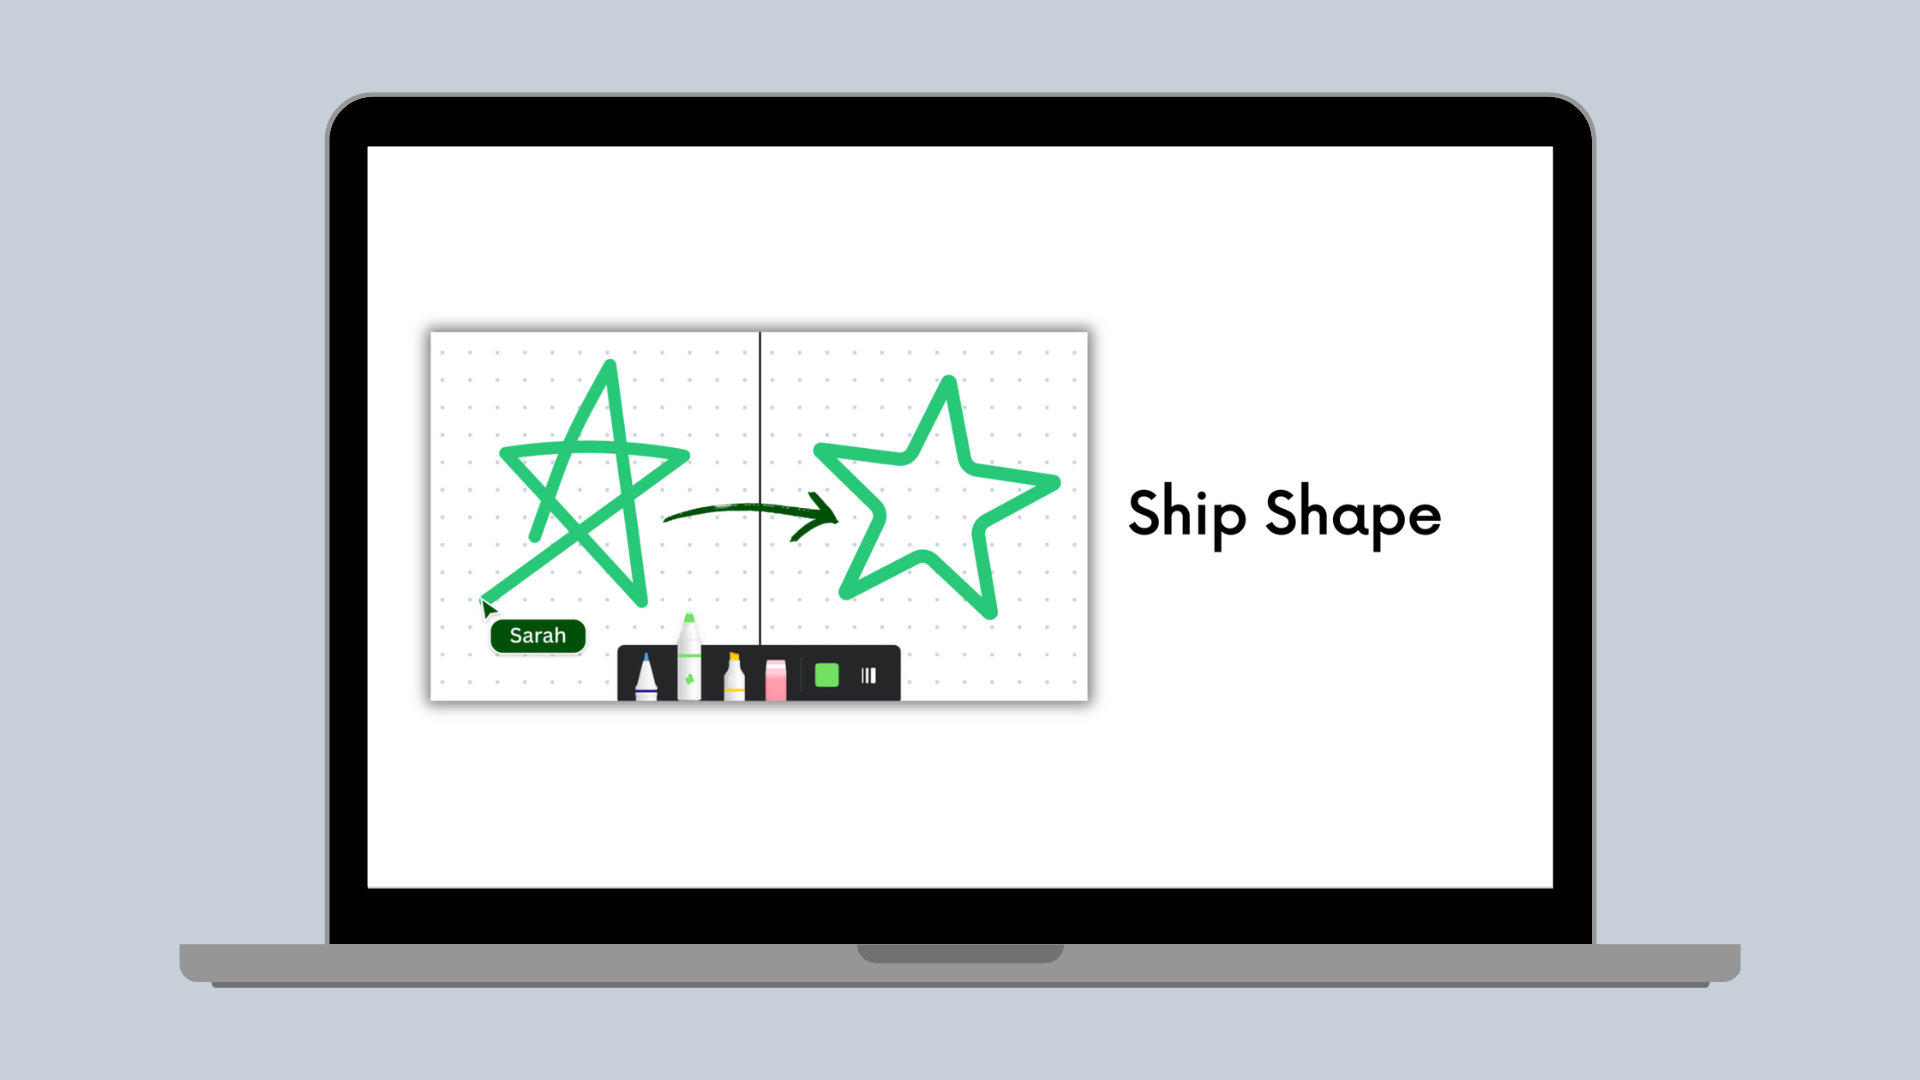
Ship Shape
How Canva does hand-drawn shape recognition in the browser
Introduction
Millions of Canva users worldwide have unleashed their creativity with our new Draw tool(opens in a new tab or window), which lets you add customized drawings to your design to make them stand out. However, if you’re anything like us, even a simple straight line drawn with a mouse or a trackpad can end up looking like a path trod by a tipsy squirrel. Don’t even get us started on circles and rectangles. So when we set out to plan the draw tool, we knew we’d need to lend a hand to those of us lacking surgeon levels of steadiness. So we built Shape Assist, which uses machine learning (ML) to turn a shaky scribble into a sleek vector graphic (you can thank us later).
Design considerations
In developing the feature, we kept classification latency at the forefront of our minds. We wanted to make sure the experience was snappy but still accurate. Therefore, we decided to deploy the solution in the browser, which allows for real-time shape recognition and drawing assistance, providing a seamless and interactive user experience. Users can draw shapes and receive immediate feedback without experiencing delays associated with server-based processing. This enhances the overall usability and responsiveness of the shape assist tool, making it more enjoyable and efficient for users.
Furthermore, running the shape assist ML model in the browser eliminates the need for continuous internet connectivity, making it accessible even in offline scenarios. People can use the shape assist tool without depending on internet connectivity, which can be especially useful in situations with limited or unreliable internet access.
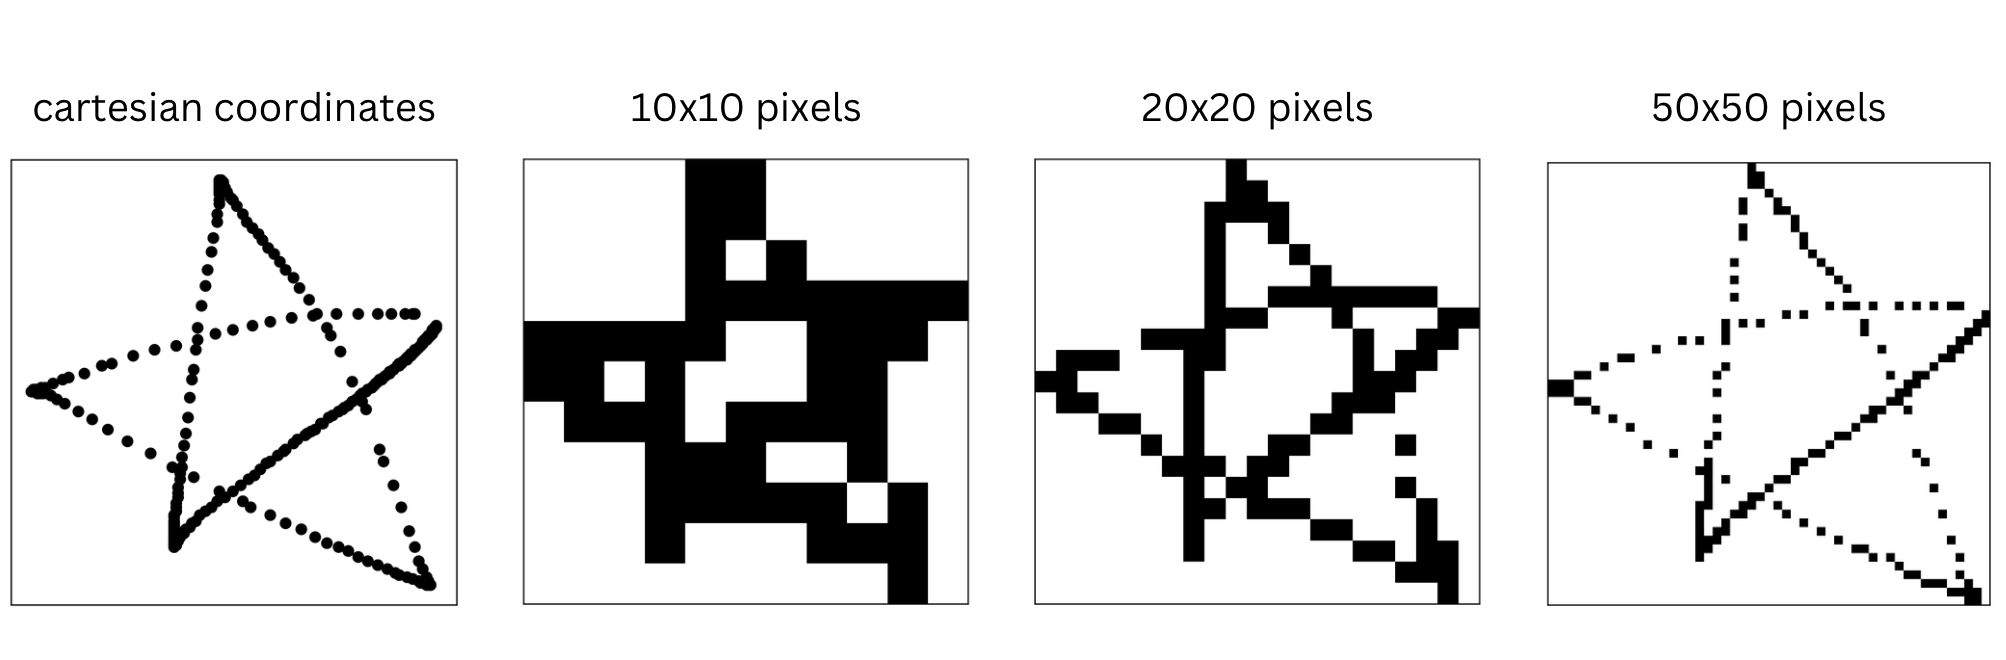
In the initial development of Shape Assist in Canva, we used computer vision heuristics to identify and recognize shapes drawn by users. We based these heuristics on pre-defined rules and thresholds to detect specific shapes, such as rectangles, circles, and triangles, by analyzing geometric properties of the cartesian coordinates of the points. While this approach provided some basic shape recognition capabilities, it had limitations when adding new shapes or handling more complex shapes. While we had already decided to limit the initial implementation to shapes people could draw with a single stroke, our proposed shape list included some that were too complex for our initial approach to handle (like clouds, stars, and hearts).
To overcome these limitations and provide a more versatile and accurate shape recognition system, we decided to switch to an ML model. ML models can learn from a large dataset of user-drawn shapes and can adapt and generalize to new shapes, styles, and variations. This allowed us to expand the capabilities of shape assist beyond simple geometric shapes to more complex and custom shapes, making it a more robust and flexible tool for users.
We designed the feature to replace the shape drawn by a user if they held down the cursor in place for at least a second after drawing. However, we also wanted to be able to keep the shape as is, without automatic replacement, if it didn't closely match any of the predefined classes.
Developing the ML model for Shape Assist involved several key steps. First, we collected a large dataset of user-drawn shapes, capturing a wide range of styles and variations. Next, we used the heavily augmented dataset to train a neural network, with preprocessing to handle user drawing style differences. Finally, we deployed the ML model in the browser using customized inference code to minimize the bundle footprint. The result is a super snappy feature that accurately identifies shapes drawn by different users.
Gathering the data
As all ML Engineers will know, the basis for a successful ML model is data, so we paid special attention to collecting and curating our dataset. We wanted to make sure Shape Assist would be delightful to diverse users, so we collected drawing data from anyone who agreed to sit still long enough to hold a mouse. We invited intrepid Canvanauts to unleash their creative spirit and draw single-stroke shapes in a simple user interface. We recorded the strokes made by users as a series of x and y coordinates, which allowed us to collect a diverse set of user-generated data, with each shape represented as a sequence of coordinates.
Using coordinates to record the strokes provided us with the flexibility to preprocess the data and perform various data augmentation techniques, further improving the model's ability to generalize. If the shapes were recorded as binary images rather than x and y coordinates, then spatial augmentations such as flipping, rotating and shearing could be applied. But by recording the data as coordinates we can also apply augmentations such as random deletion of coordinates, random jittering of point location, reversal of point order, among others.
Canvanauts love a chance to get involved and help out other teams, so even just from volunteer efforts, we managed to collect a sizeable dataset. However, we quickly learned that our engineers and designers aren’t very representative of the average Canva user. For example, ML engineers have a penchant for providing adversarial data, and our designers are so talented we could probably sell their doodles (we even instructed some to draw with their non-dominant hand to make it fairer for the rest of us mere mortals). Thankfully, after providing some stricter guidelines and expectations, we obtained a sizeable dataset.
Designing and training the model
Since we wanted the ML model to run client-side, and we didn't want to have a detrimental impact on page load time, we needed to keep the size of the model to a minimum. Therefore, instead of using a Convolutional Neural Network (CNN)(opens in a new tab or window) that required converting the points into pixels, we decided to experiment with a Recurrent Neural Network (RNN)(opens in a new tab or window), which directly used the strokes' x and y coordinates.
To identify the optimal model attributes, we performed a hyperparameter sweep, tweaking various parameters such as input size, number of layers, and number of features in the hidden state. We tried different combinations to find the sweet spot for our Shape Assist model.
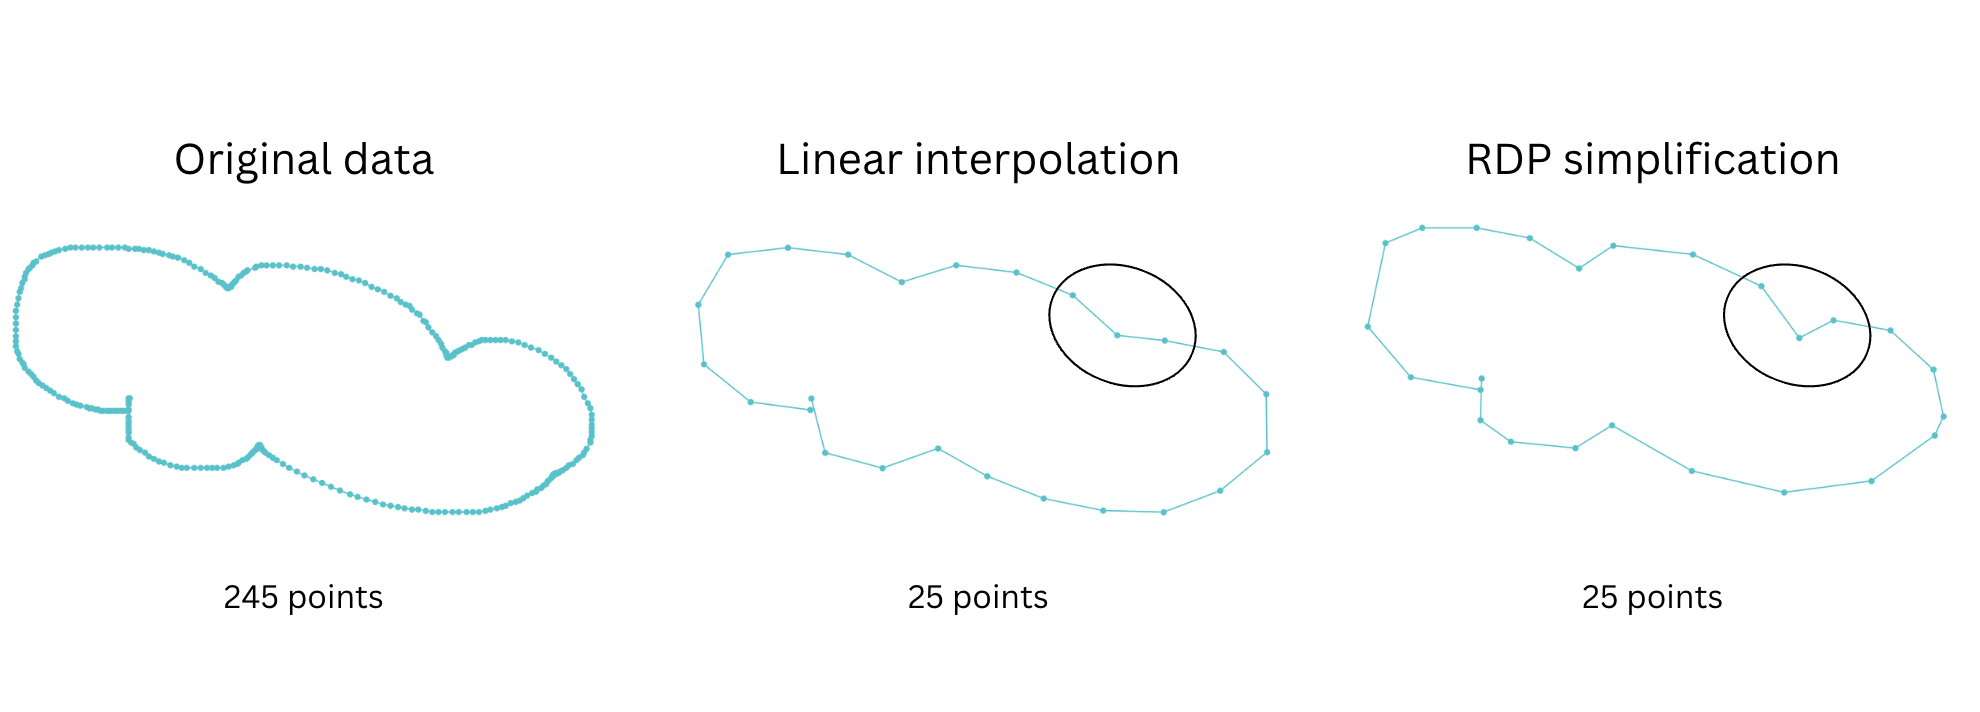
One challenge we encountered while developing the Shape Assist model was that different users draw at different speeds. This resulted in varying lengths of the list of points describing a given shape, with more points in the list for users who draw slowly than those who draw quickly. To ensure the model could generalize well to different drawing speeds, we needed to fix the number of points representing each shape. While we could use piecewise linear interpolation to evenly distribute points, we found this approach tended to remove key points, resulting in a loss of important detail. Instead, we developed a variation on the Ramer-Douglas-Peucker (RDP) algorithm(opens in a new tab or window), which is a curve simplification algorithm that reduces the number of points in a curve while preserving its important details. It achieves this by recursively removing points that deviate insignificantly from the simplified version of the curve.
Adding to the complexity of training the model, we knew that we wanted the option of rejecting the model prediction if the shape didn't closely resemble one of the predefined classes.
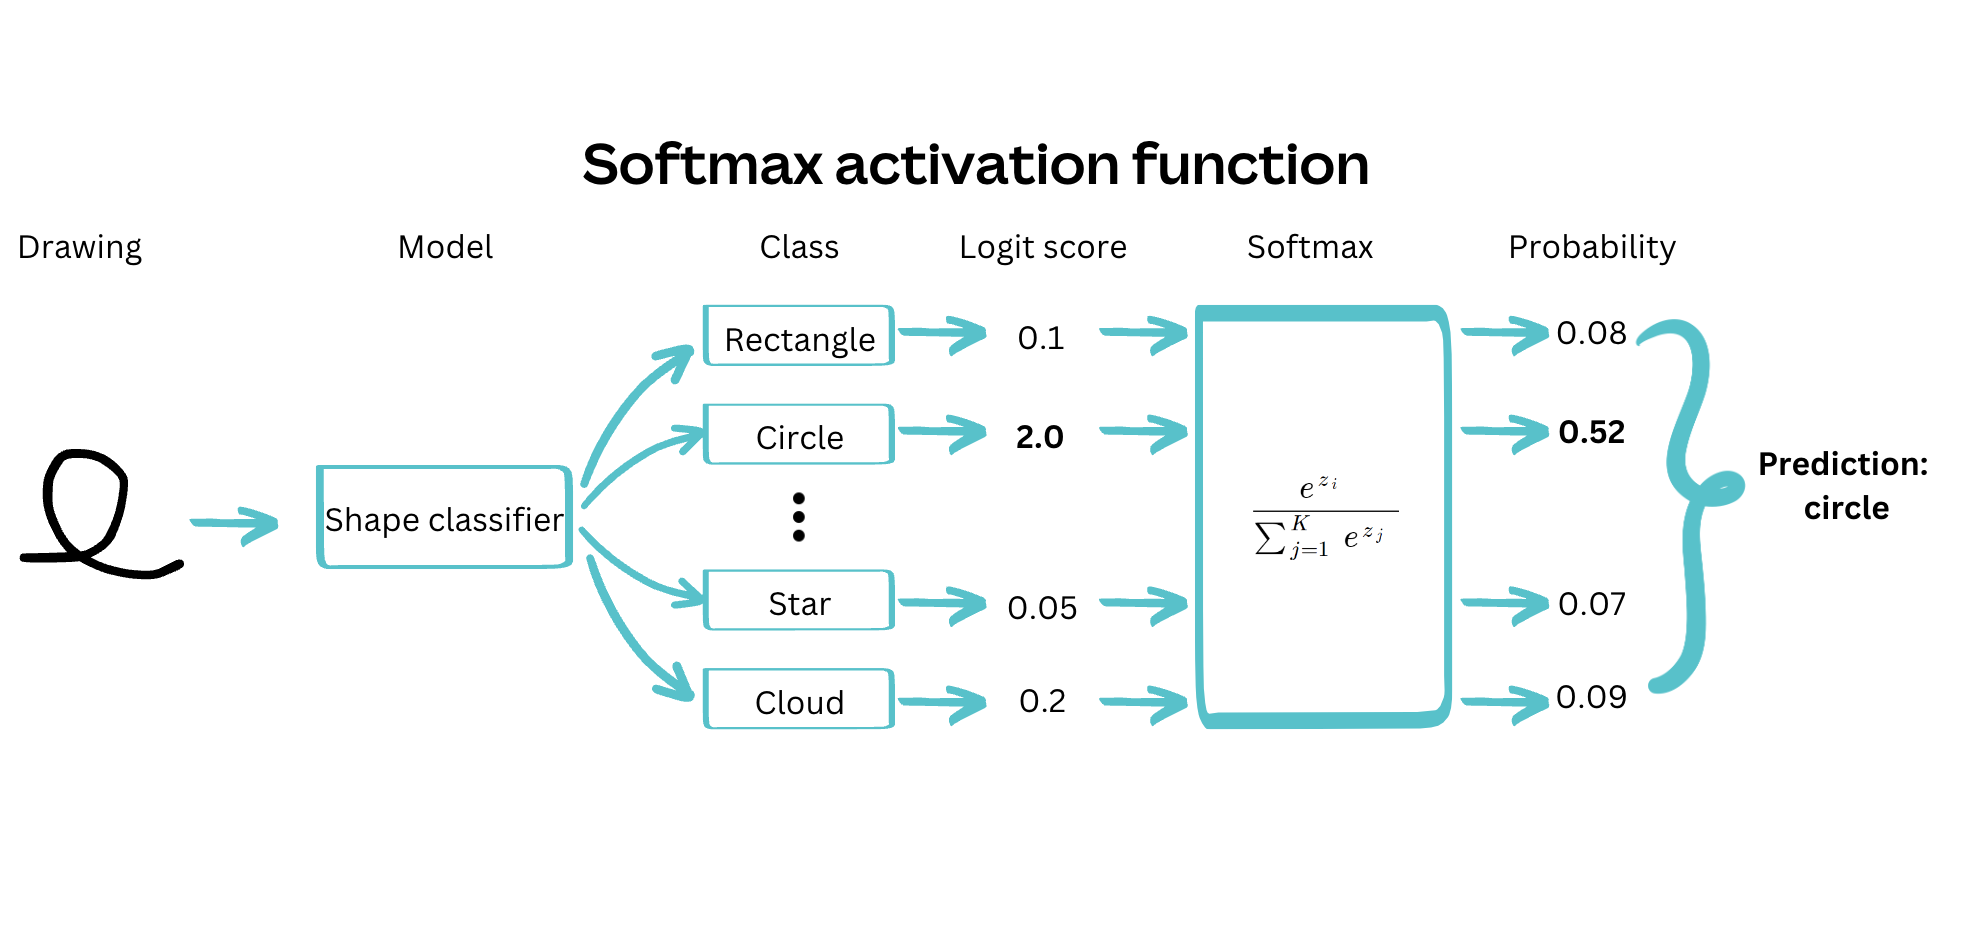
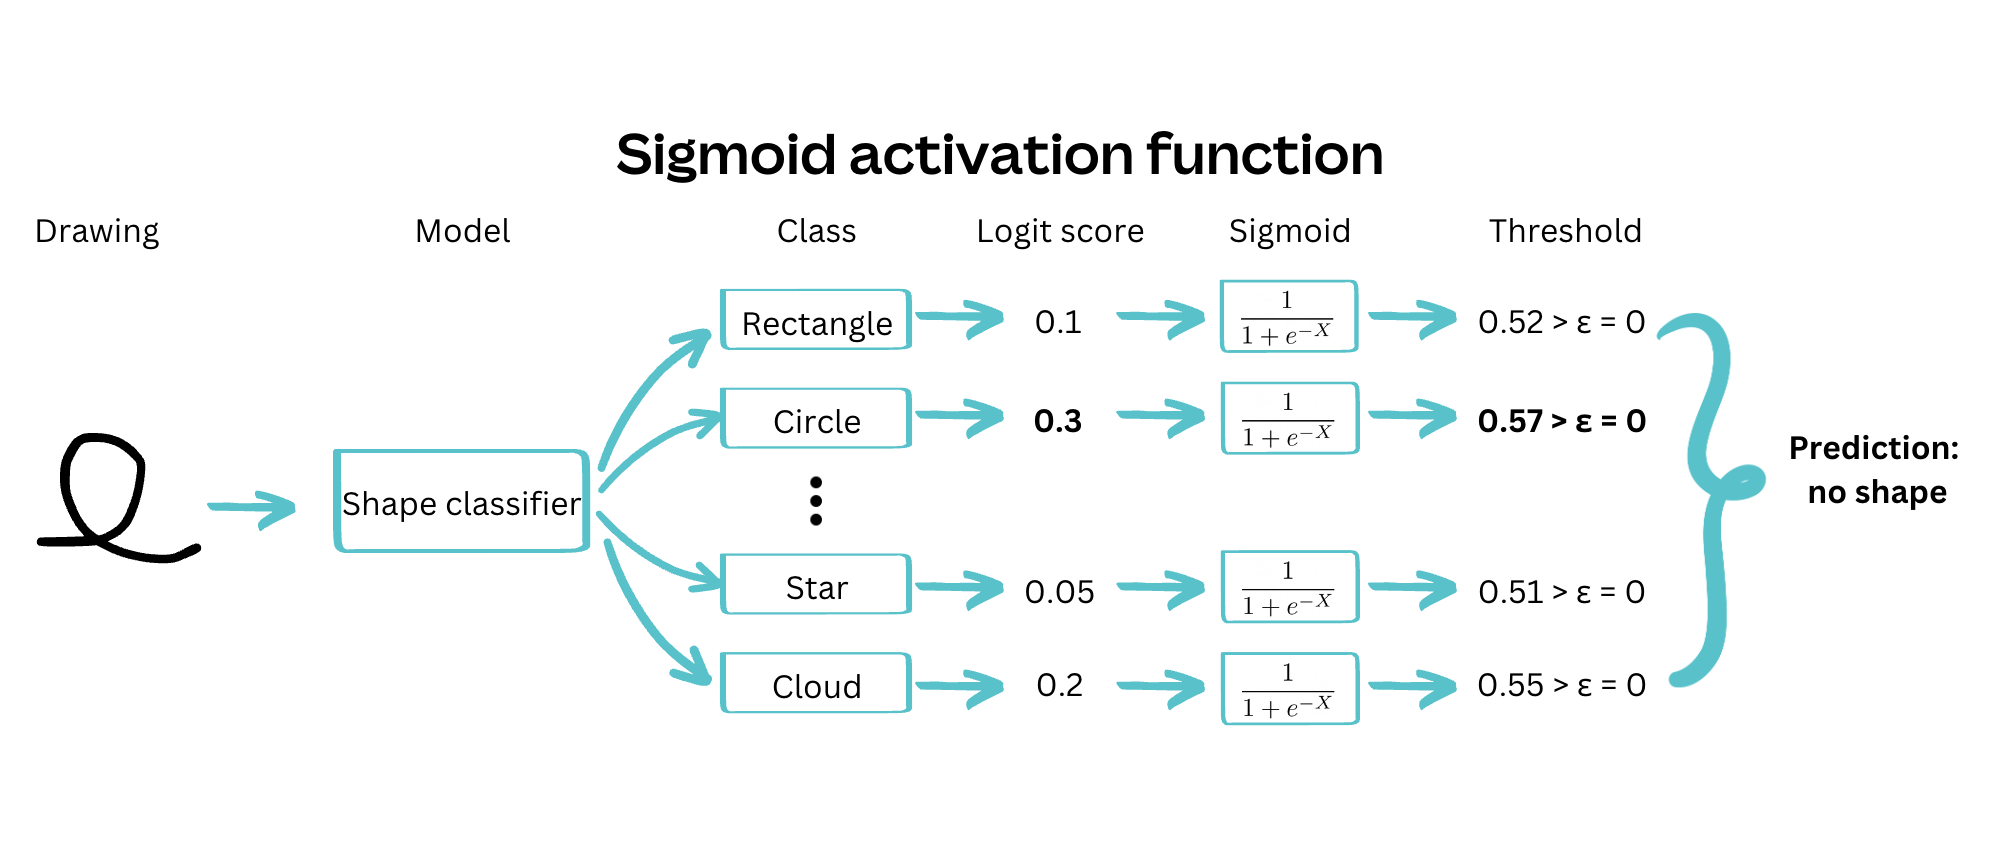
Given that only one shape could be correct at a time, a softmax activation function, combined with a cross-entropy(opens in a new tab or window) loss, was the obvious choice. We could reject the prediction if the confidence associated with the highest-probability class was below a given threshold. However, we found that this approach led to models with high confidence, even when wrong. Therefore, we opted instead to train the model as a multi-class multi-label classifier, using sigmoid activation functions on each output class, and rejecting the prediction if no classes were above a given threshold.
Deployment trade-offs
Once we had decided on the appropriate architecture and carefully trained the model, it was time to put it in the hands of our users. Often ML models are large and computationally intensive, so they live on powerful (expensive) computers in the cloud.
As it turns out, our model is pretty small and contains only a few mathematical operations, which allowed us to consider running all the processing inside the client application. With this approach, we eliminated the need for a connection to the server - the feature works entirely offline. As a bonus, eliminating the round-trip time to the server means that we recognize shapes almost instantaneously.
Model architecture
So, exactly how big is the model, and what operations does it do? Let’s draw it (with itself)!
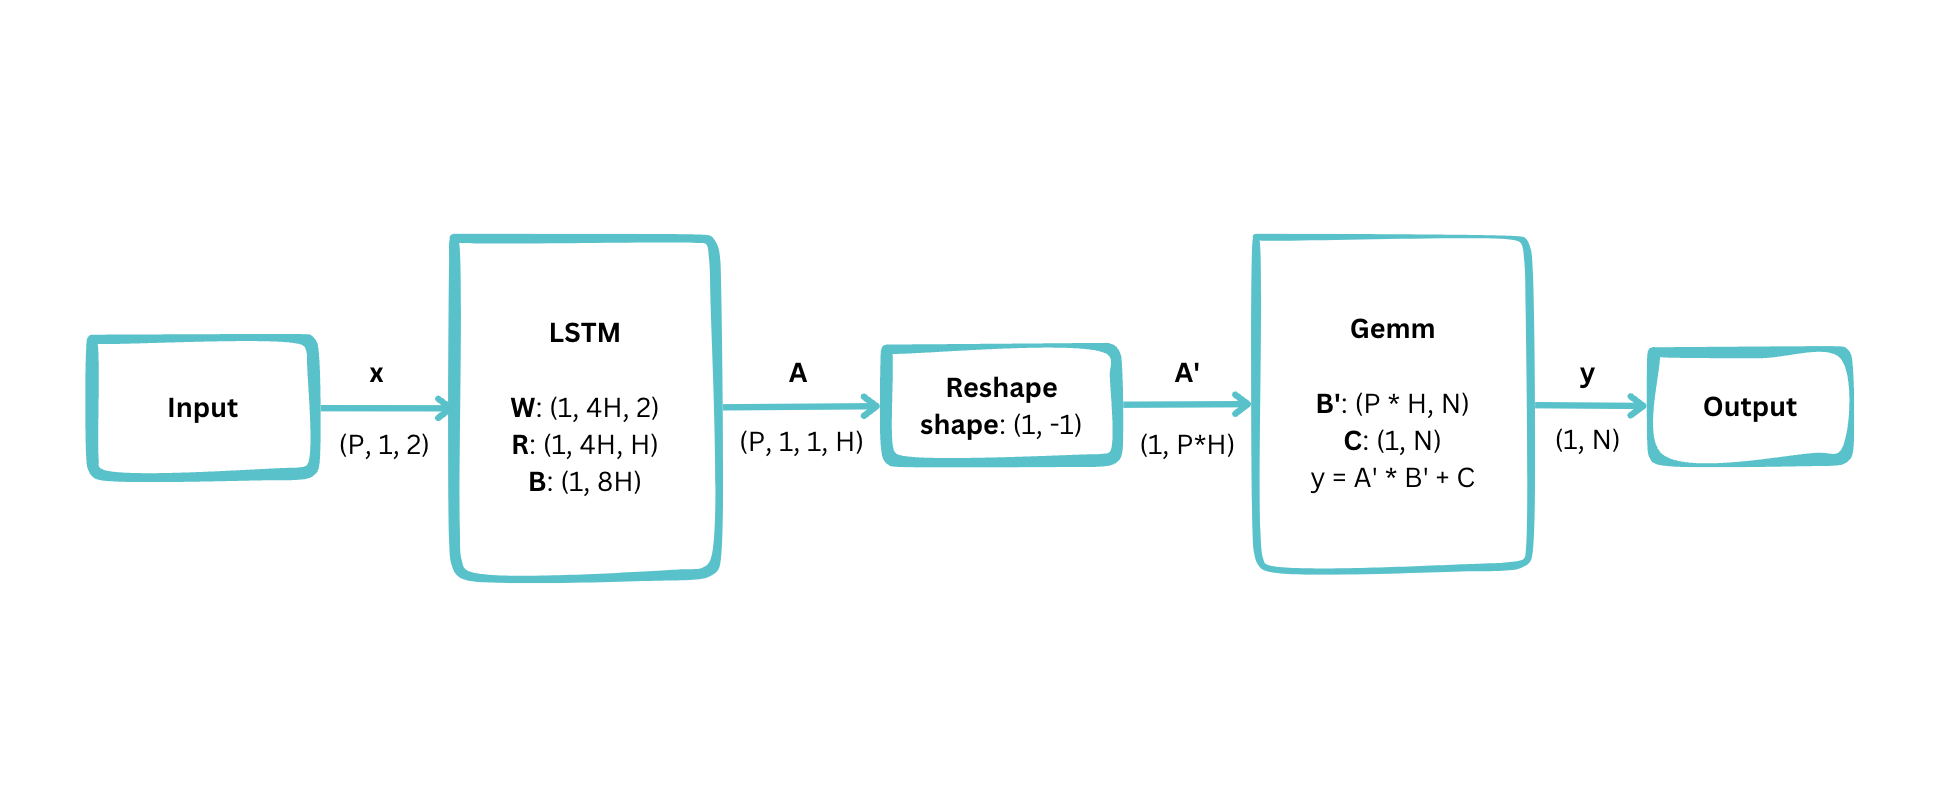
From these beautifully polished rectangles and arrows, you can see that we arrived at a structure consisting of a single Long Short Term Memory (LSTM) layer, followed by a General Matrix Multiply (Gemm, also known as a Dense or Fully Connected layer).
This diagram shows some important configuration variables:
- Number of interpolated points:
P = 25 - Hidden size:
H = 100 - Number of predefined shapes:
N = 9
Using these values, we can derive the total number of parameters:
- LSTM:
4H * 2 + 4H * H + 8H = 41,600 - Gemm:
P * H * N + N = 22,509 - Total:
64,109
With 4 bytes per parameter (IEEE754 32 bit floating point), the model is roughly 250 kilobytes in size, approximately equivalent to a single uncompressed 360p 16:9 image. We can potentially bring this down even further by storing the parameters at a lower precision.
To run the model on the client, we needed a way of performing the LSTM and Gemm operations. Instead of using a general-purpose ML engine for this, we elected to build them from scratch directly in Typescript. While this approach doesn't generalize well to more complex models, it did allow us to deliver this feature quickly while keeping our options open for more sophisticated kinds of processing in the future. The resulting implementation is less than 300 lines long and runs in under 10 milliseconds on a modern laptop (about ten times faster than you can blink!).
Shape replacement
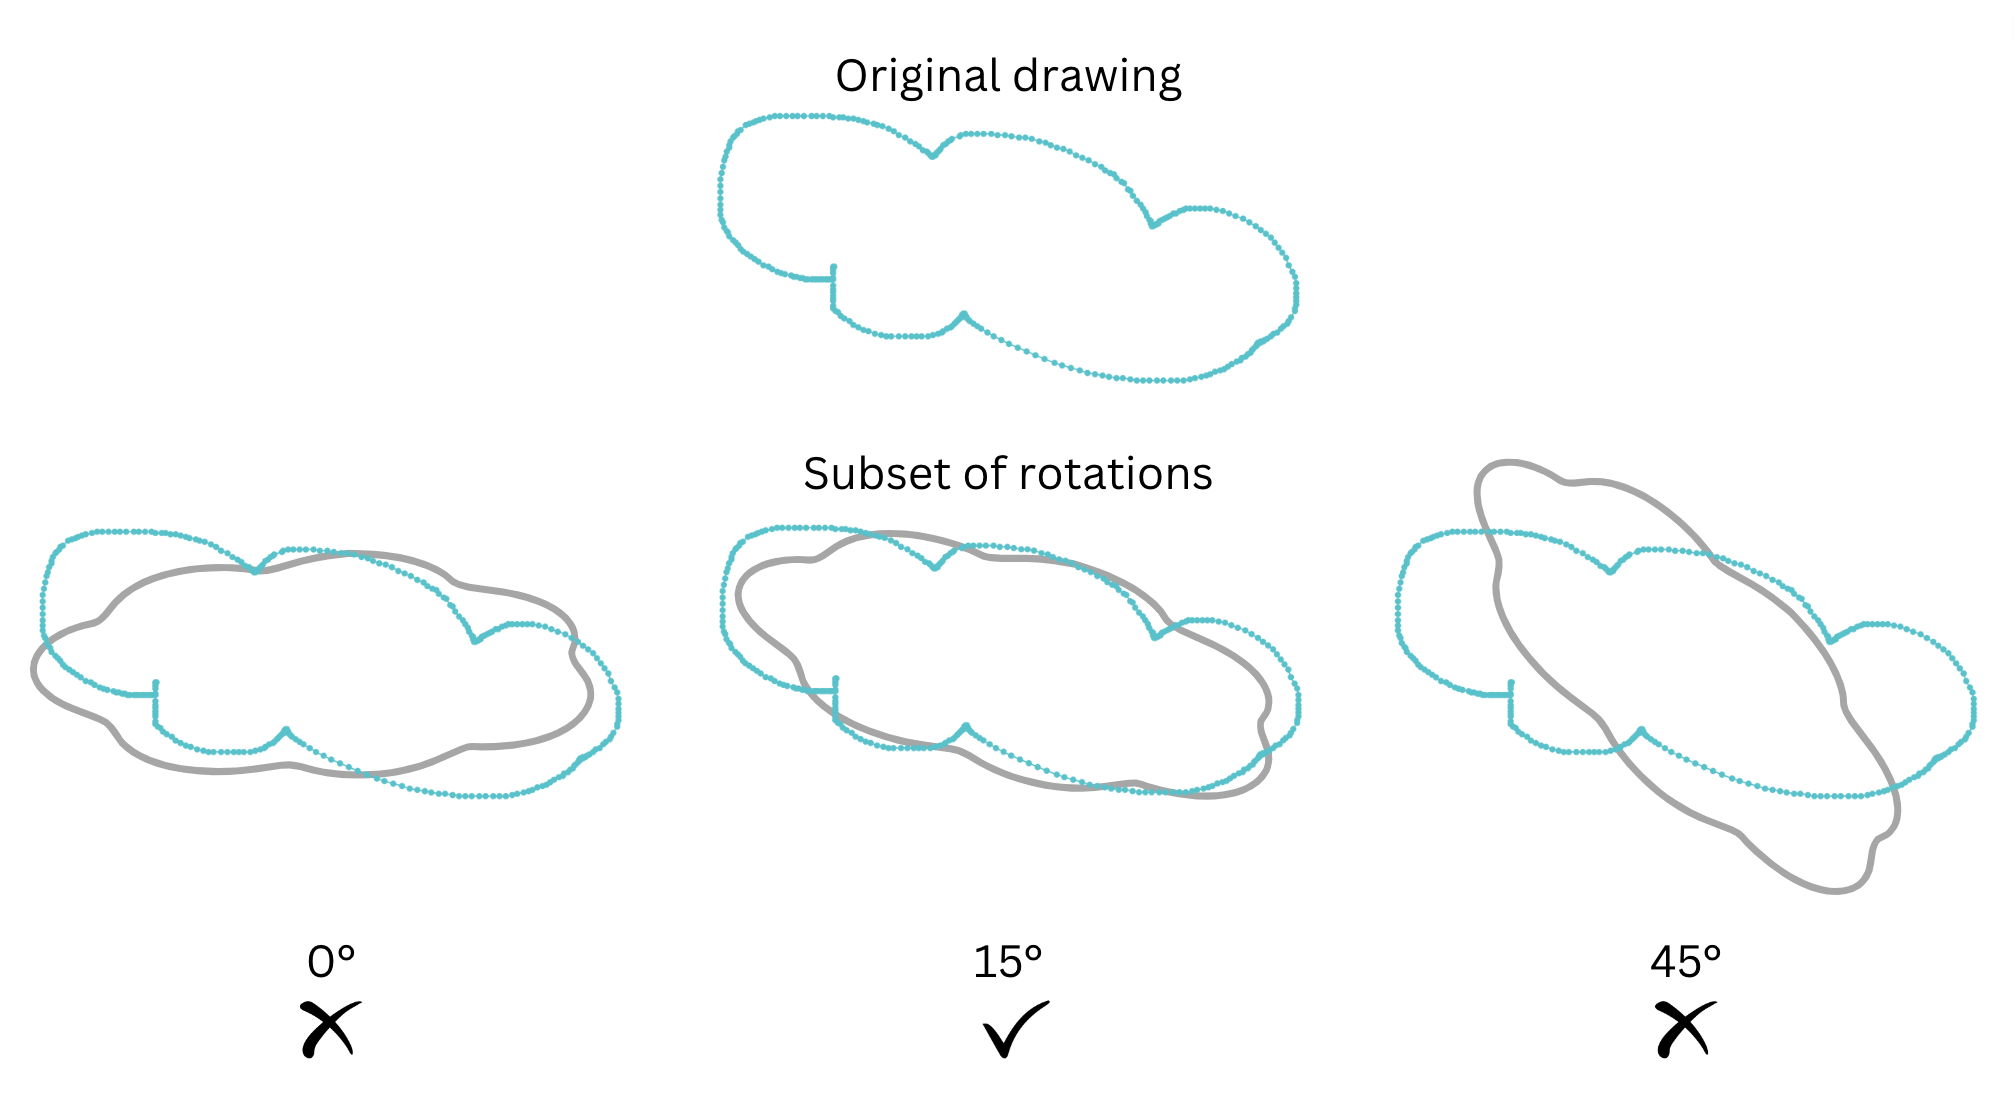
After using the model to determine what shape a user drew, we used a template-matching approach to accurately align the user-drawn path with a vector-graphic representation. This involves normalizing both the input shape and template shape, trying 15° rotations of the template shape, computing the first and second moments of the input points in the rotated coordinate space, and calculating dissimilarity between the input points and the template shape. The rotation with the smallest dissimilarity is selected as the optimal angle.
Conclusion
We’re super stoked to be able to share this feature with the world. We had a lot of fun building it, and whether you’re an expert designer or a scribbler, we hope you enjoy the extra sparkle it can bring to your creations.
Acknowledgements
Huge thanks to Kevin Wu Won(opens in a new tab or window), Alex Gemberg(opens in a new tab or window) and the whole Whiteboards team for all their work on Draw and Shape Assist, and for trusting us with our crazy ideas. Also thanks to Thibault Main de Boissière(opens in a new tab or window), Paul Tune(opens in a new tab or window) and Grant Noble(opens in a new tab or window) for reviewing this article. Shout out to everyone who contributed to and/or wreaked havoc on the dataset, you know who you are.
Interested in building machine learning systems at Canva? Join us!(opens in a new tab or window)