Data Platform
Service-aligned Data Platform Architecture
How the data analytics platform team scaled data ingestion from various services at Canva.
Introduction
The data analytics platform at Canva empowers the business to make data-driven insights and decisions. The platform ingests and processes data from multiple sources, including a growing number of internal first-party services. We use these insights to provide a better experience for our users.
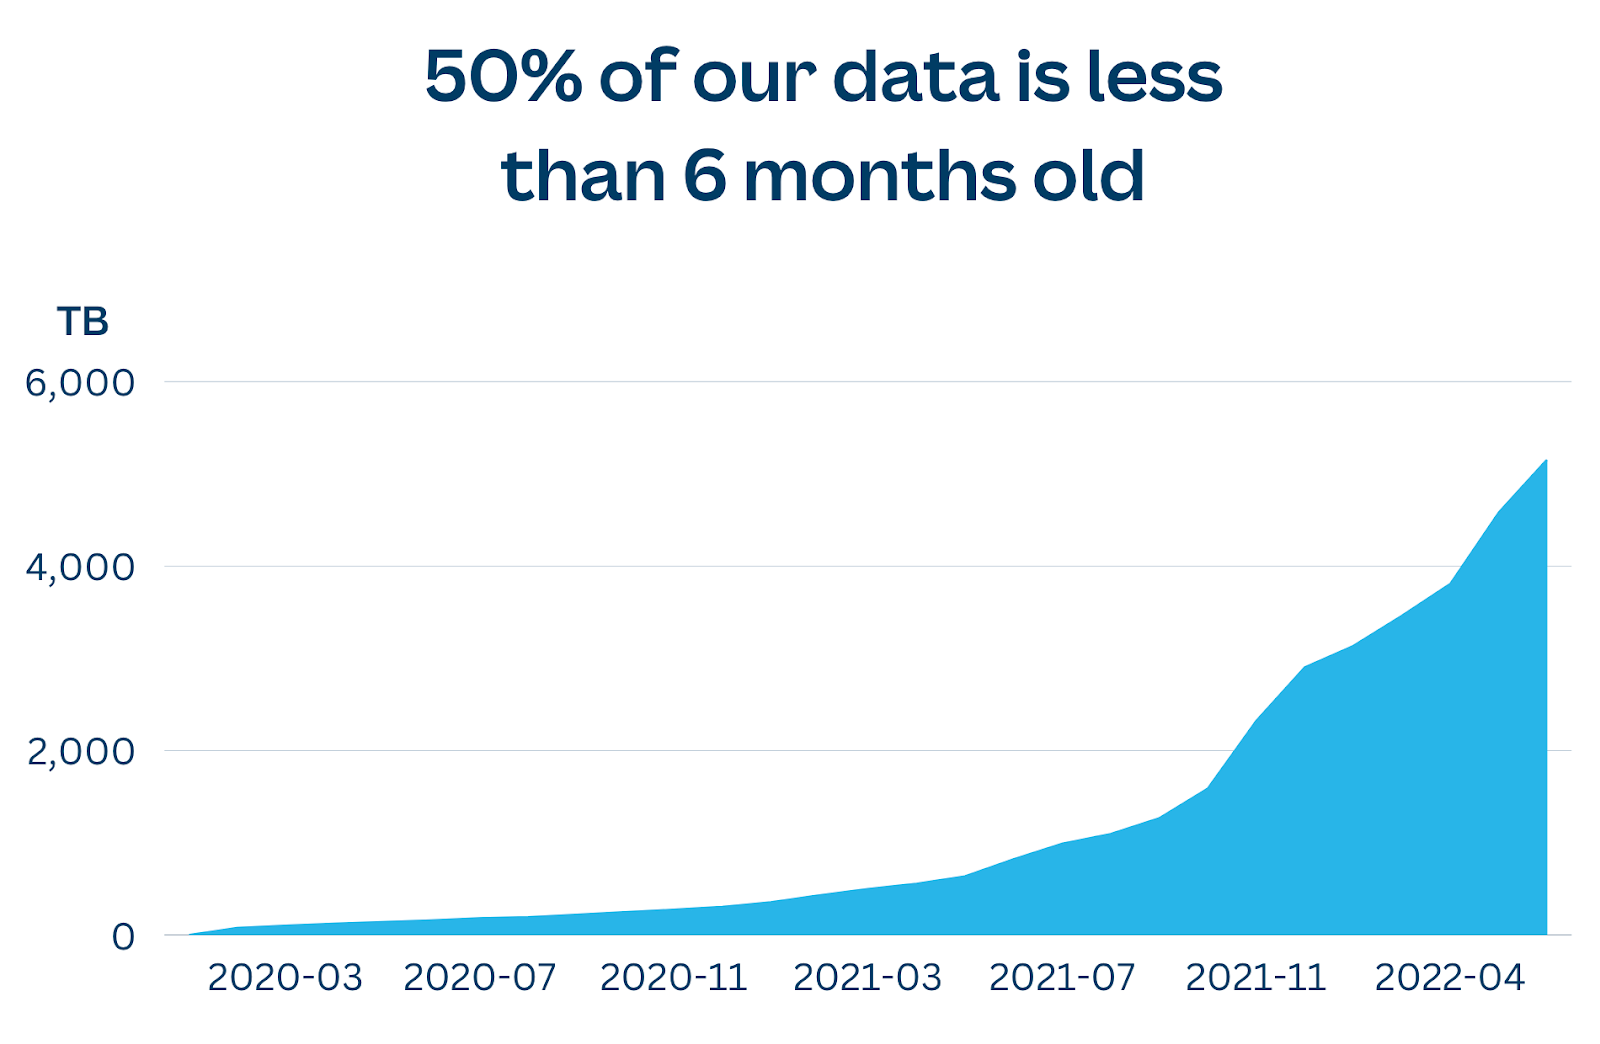
At the time of writing, we currently have over 5 Petabytes (5000 Terabytes) of data stored in Snowflake(opens in a new tab or window). The increase in the number of Canva services and the growing volume of data has led us to evolve our approach to first-party data extraction to keep up with the scale we are working with.
In this blog post, we'll discuss our move from a legacy snapshot replication system, which was unable to scale with our growth, to a new service-aligned extraction process that utilizes a change-data-capture(opens in a new tab or window) (CDC) system. We'll also cover our ongoing journey into elevating data as a first-class product at Canva.
Snapshot replication
A data warehouse(opens in a new tab or window) is a data storage system used and optimized for analytical and reporting purposes. For data to be analyzed in the data warehouse, services first replicate their data from source databases via an extraction process to AWS's Simple Storage Service (S3)(opens in a new tab or window).
We used a snapshot extraction system to take a full snapshot of our service databases every 24 hours into an S3 bucket. A scheduled run then ingests these files from S3 into the data warehouse on a set cadence.
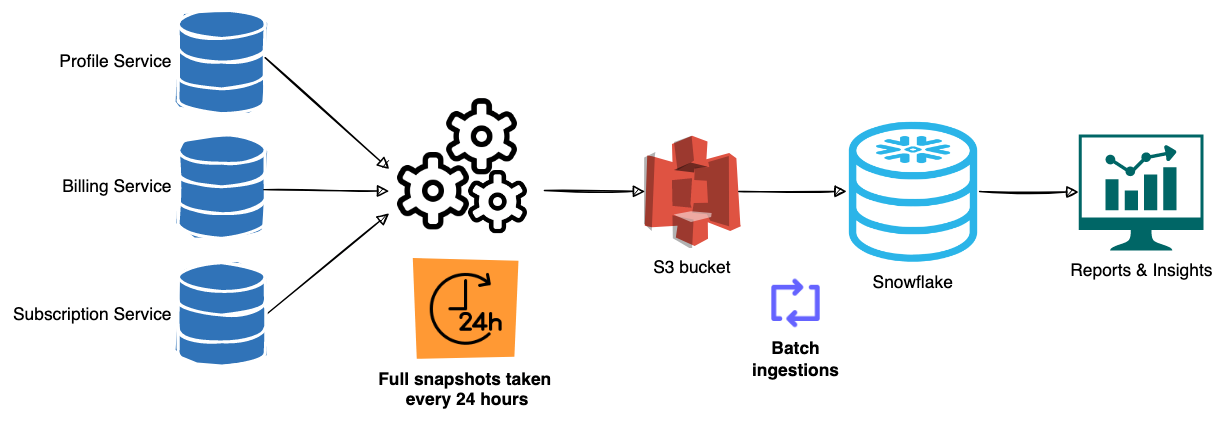
However, this system has shown its limitations as many of Canva's services have increased their data storage requirements. This resulted in a significant increase in extraction time. If an extraction takes more than 24 hours, the scheduled job to load data into the warehouse would not be ready to ingest a complete extract. This leads to an inconsistent view of the data and, subsequently, delays in business decisions.
Extraction times were getting longer as we stored more data on these service databases. We urgently needed a more efficient extraction process.
Change-data-capture to the rescue
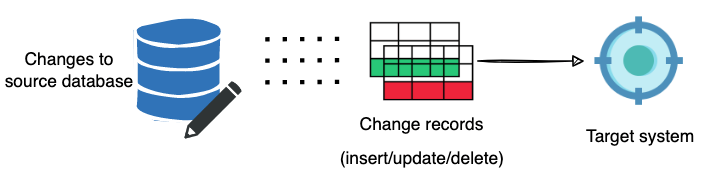
Instead of taking a full snapshot of a database, a CDC replication
system only captures changes in data. This involves keeping track of
Data Manipulation Language (DML) changes such as inserts, updates,
and deletes. The changes are sent as JSON records to a target system
to build the current representation of the source database. The change
records are extracted continuously as the source database changes. This
continuous stream of data sent over the network is significantly smaller
than daily snapshots.
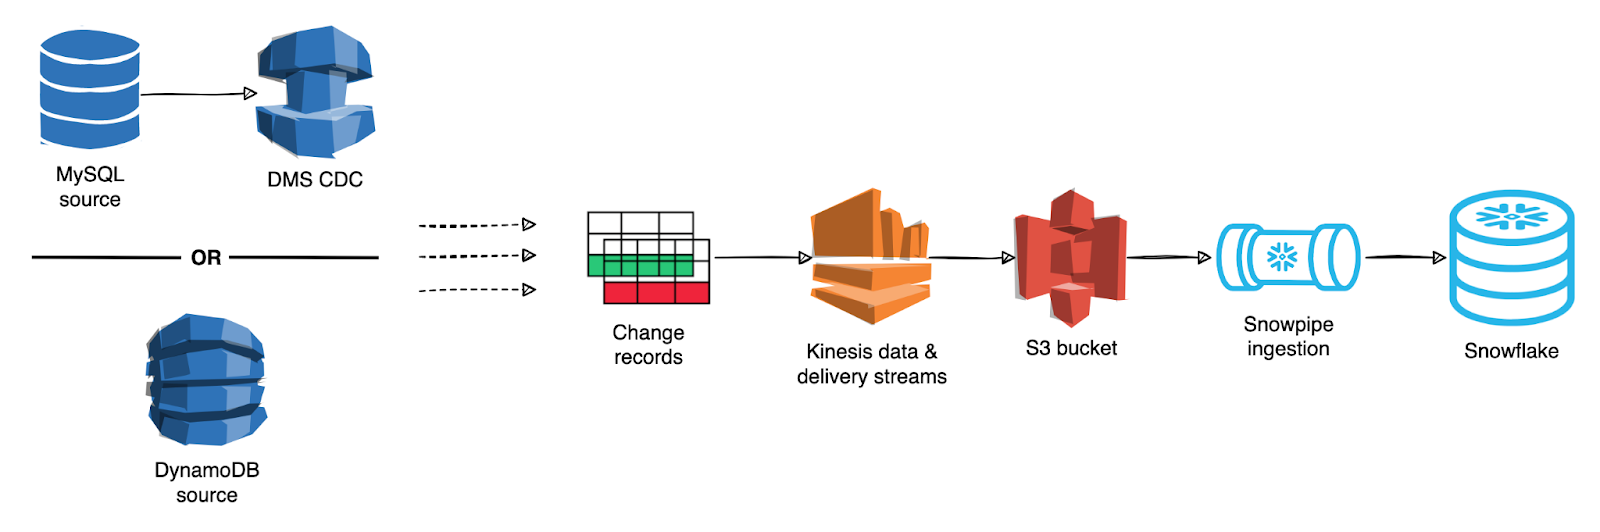
For MySQL databases, we use an AWS DMS(opens in a new tab or window) feature of continuous replication that captures ongoing changes. For DynamoDB sources, we use Kinesis Data Streams for DynamoDB(opens in a new tab or window), which also provide a flow of information about changes on a table.
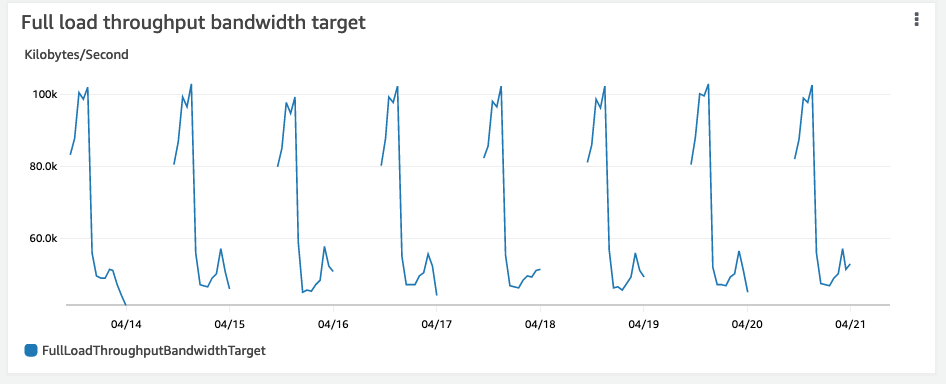
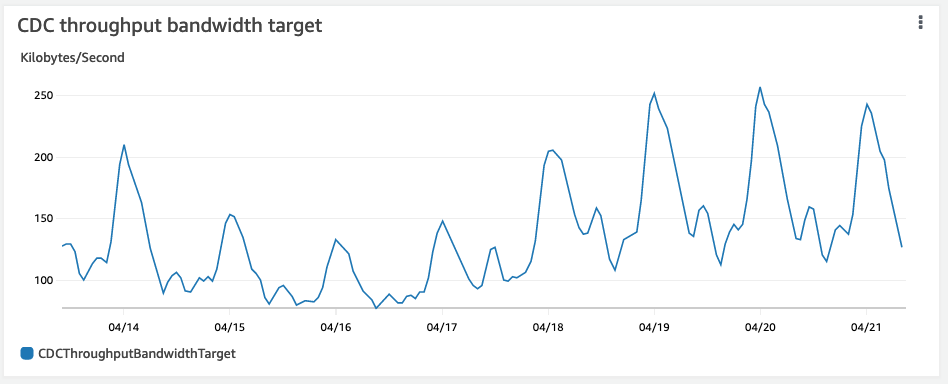
The CDC approach results in data being pushed over the network in short bursts instead of a 24-hour cycling spike. The following charts show a comparison of data throughput over a week for full snapshots and CDC using DMS.
Ingestion of streaming data
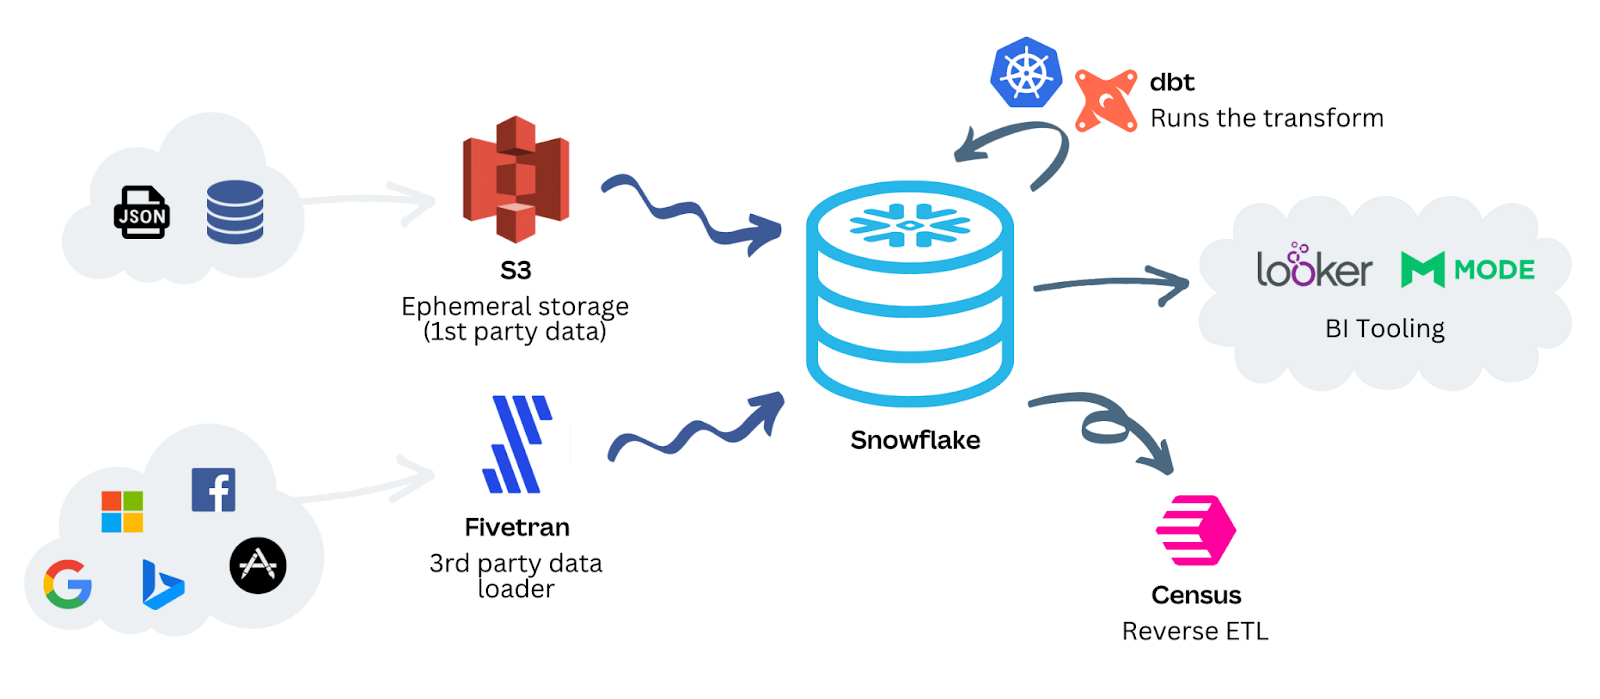
Because of the streaming nature of the CDC records, we use a publish-subscribe architecture for the delivery of records into a partitioned S3 bucket via Kinesis Data Firehose(opens in a new tab or window). This approach decouples the source from the target system and allows them to scale independently.
We also use Snowflake's Snowpipe(opens in a new tab or window) to continuously ingest new data from an S3 bucket. Within minutes, we expect that CDC updates will be available in the warehouse for processing. After the CDC records are in the warehouse, they'll be processed to achieve a similar table as if it had been extracted with the snapshot method. This higher velocity of data has given us more flexibility in how we schedule our load and transform jobs in the warehouse. We're no longer blocked by the snapshot extraction process.
The following diagram shows the overall CDC replication and ingestion architecture.
Service-aligned data architecture
While the CDC replication solves the issue of increasing database storage requirements at Canva, there's another dimension of the problem in terms of ownership of a service's data and pipelines.
We're currently on a journey to have a service-aligned data architecture that has data-mesh-like characteristics. Instead of using technology to separate the architecture and ownership of the analytical plane, we use the domain of a service to logically group resources together.
Defining Infrastructure as Code(opens in a new tab or window) (IaC) is a well-adopted process at Canva to create reproducible infrastructure. We've taken advantage of this to provide service owners the ability to create and own the end-to-end data infrastructure for their service. With common modules set up by the data platform specialists, service owners can create the necessary infrastructure to publish their data for analytical purposes.
To treat data as a first-class product, service owners need to be empowered to define how their data is published and consumed. This is because they know the data they produce very well.
In practice, we've structured data in the following layers in the warehouse for each Canva service:
- Source layer: Contains the raw data replicated from a service database.
- Model layer: Contains transformed and modeled data with business logic defined by the service owner.
- Expose layer: Contains data that a service owner wants to publish for downstream consumers.
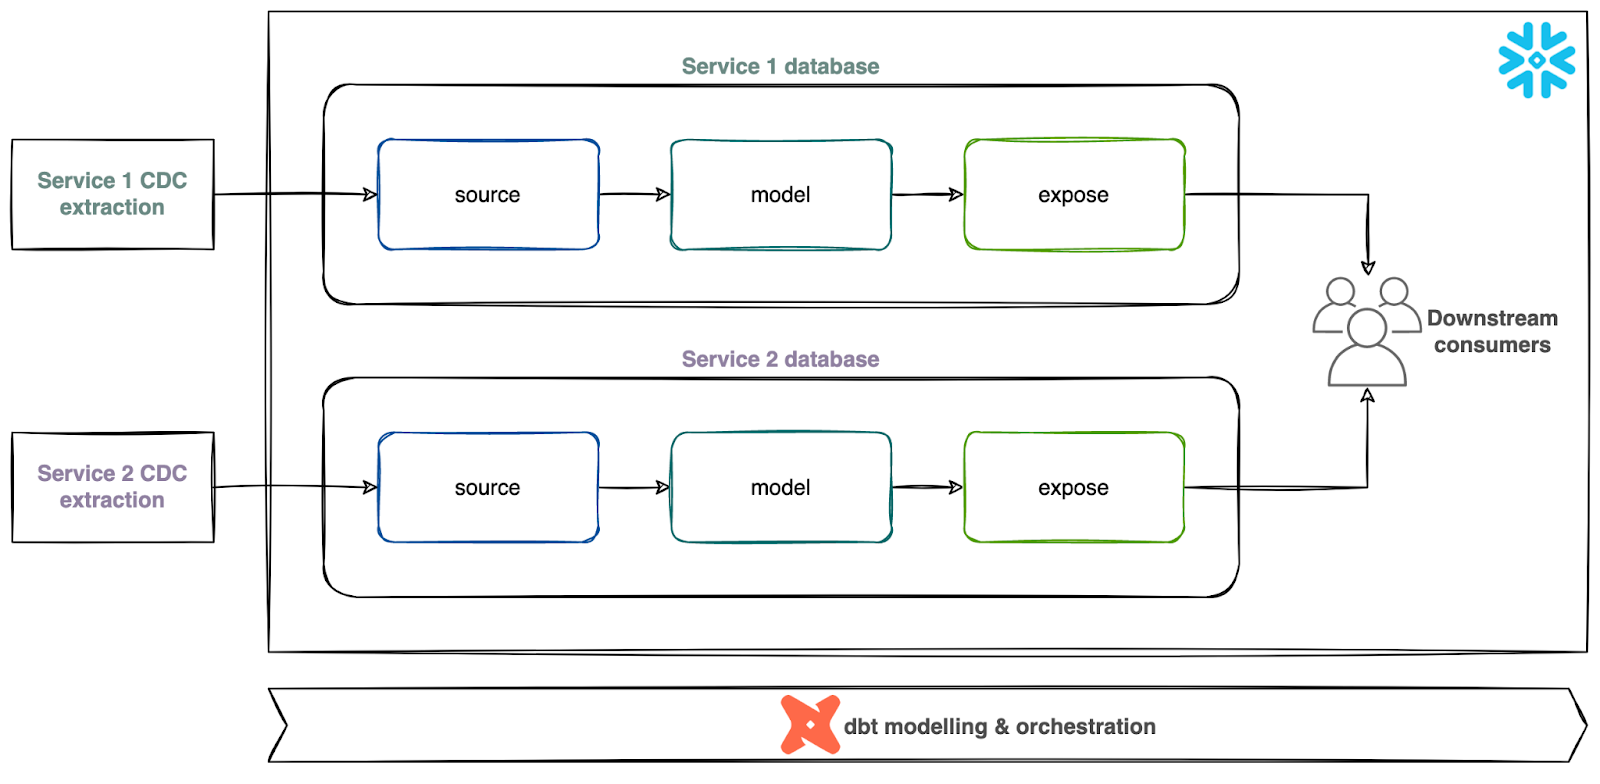
The warehouse uses dbt(opens in a new tab or window) (data build tool) to orchestrate the load and transform pipelines. The tool enables data specialists to build insights by refining, joining, and aggregating different data sources.
For service owners to be part of the conversation, we use dbt configuration files to expose the warehouse as an explicit dependency of the service. The configuration files serve as a bridge between the persistence layer of the raw data and the business logic transformations required to turn it into useful information.
Final thoughts and where to from here
This blog post described the scale and volume of data we are working with at Canva. We've described the scaling challenges we faced with snapshots and how we architected a service-aligned solution to logically group resources as part of a service domain.
The move to CDC helped us adjust our load and transform schedules with more flexibility. While we migrated CDC to services that urgently needed to switch over from a snapshot extraction, there's still more work for us to roll out the pattern for more services.
Our journey to implement and operate a service-aligned data architecture is still an ongoing and evolving process. There are also opportunities for us to explore more advanced orchestration processes and observability of the overall status of the mesh. As more services are added to the mesh, certain dependencies will evolve and would have to be explicitly defined as part of a workflow.
Acknowledgements
Thank you to Guy Needham(opens in a new tab or window) for the design and development of the backend service extraction and infrastructure modules. He drove collaboration for the business and stakeholder buy-in. Thank you to Krishna Naidu(opens in a new tab or window) and Joao Lisboa(opens in a new tab or window) for the collaborative design and implementation work to integrate and process the data in the warehouse. Thank you as well to Grant Noble(opens in a new tab or window) for providing us technical writing feedback.
Interested in scaling our data infrastructure? Join us!(opens in a new tab or window)