Backend
Scaling to Count Billions
How we built a scalable and reliable content usage counting service.
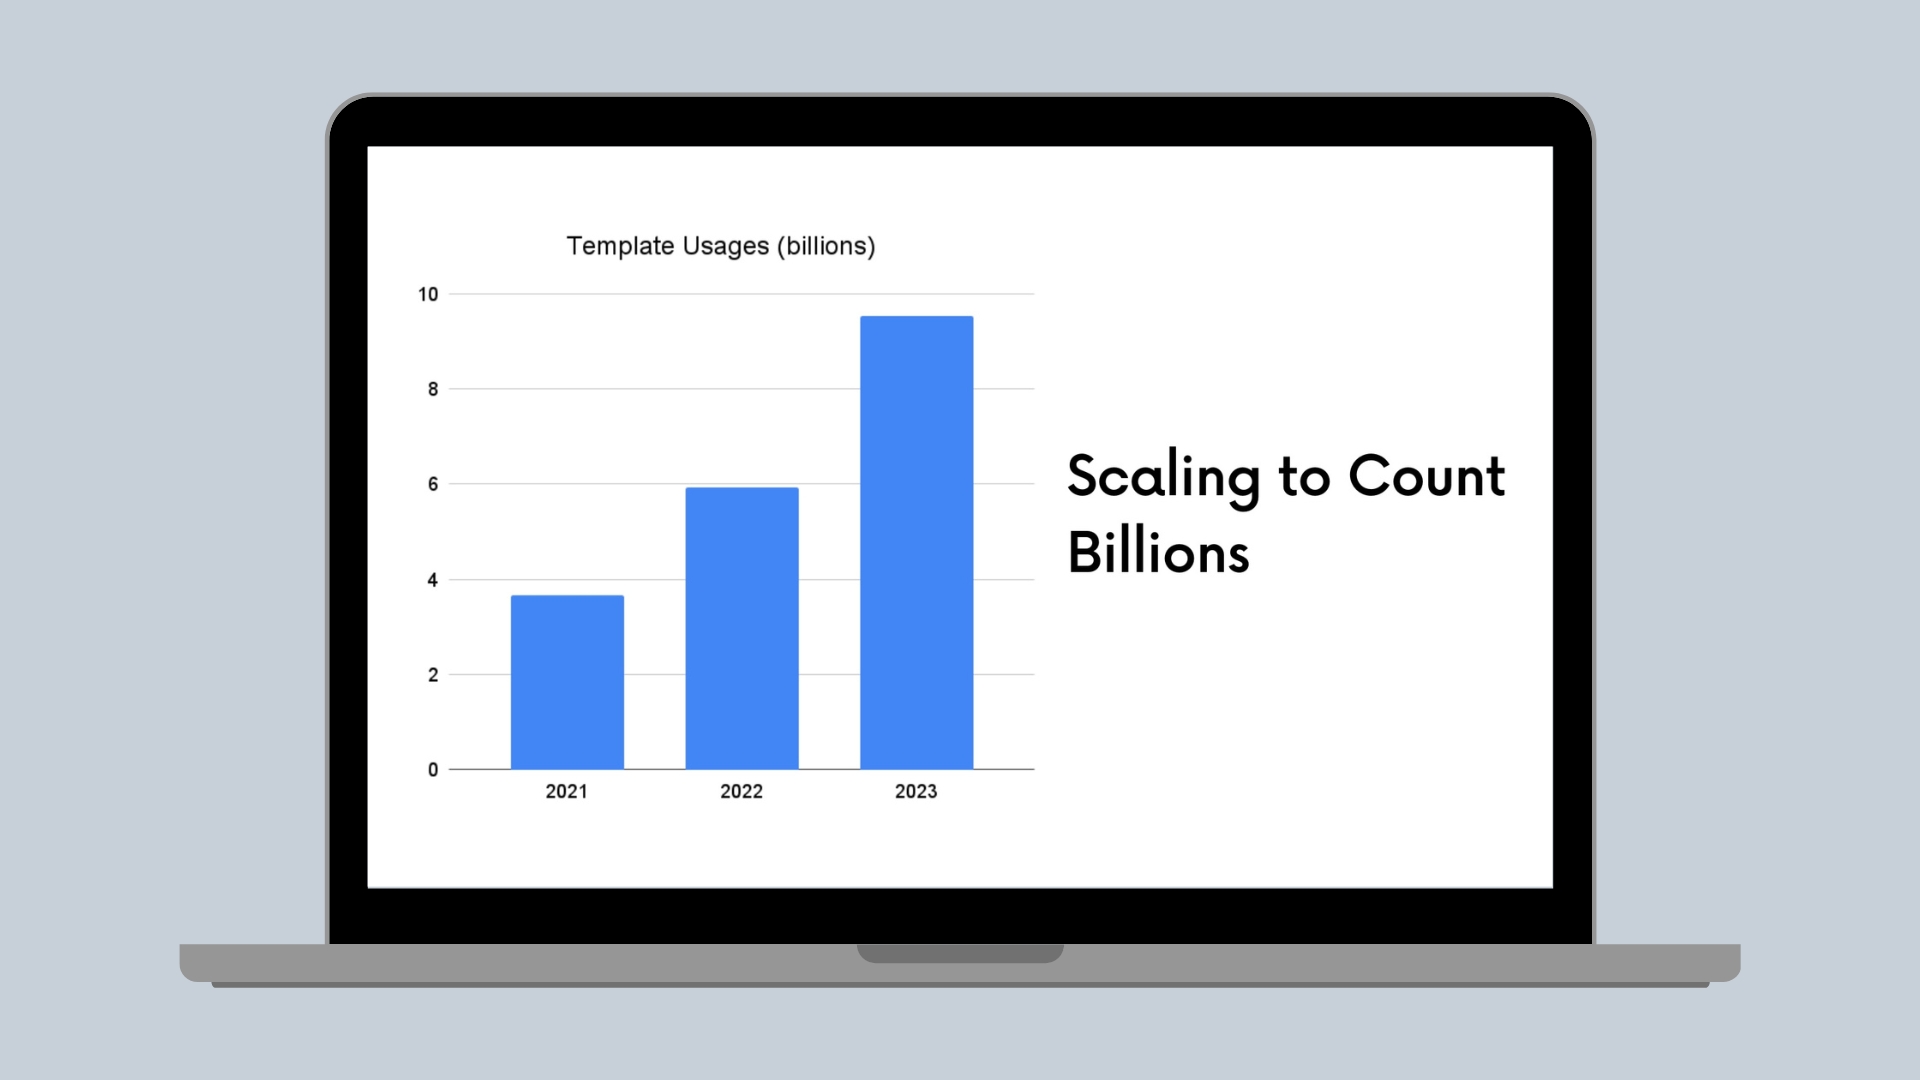
Canva’s mission is to empower everyone in the world to design anything and publish anywhere. An essential part of our effort toward this goal is the Canva Creators(opens in a new tab or window) program. Since we launched the program 3 years ago, usage of our creator content has doubled every 18 months. Now we pay creators based on billions of content usages each month. This usage data not only includes templates but also images, videos, and so on. Building and maintaining a service to track this data for payment is challenging in the following ways:
- Accuracy. The usage count should never be wrong, and we want to minimize issues such as data loss and overcounting because the income and trust of content creators are at stake.
- Scalability. We need to store and process usage data with this large volume and exponential growth over time.
- Operability. As usage data volume grows, the operational complexity of regular maintenance, incident handling, and recovery also increases.
This blog post introduces the various architectures we’ve experimented with and the lessons we learned along the way.
The Solution
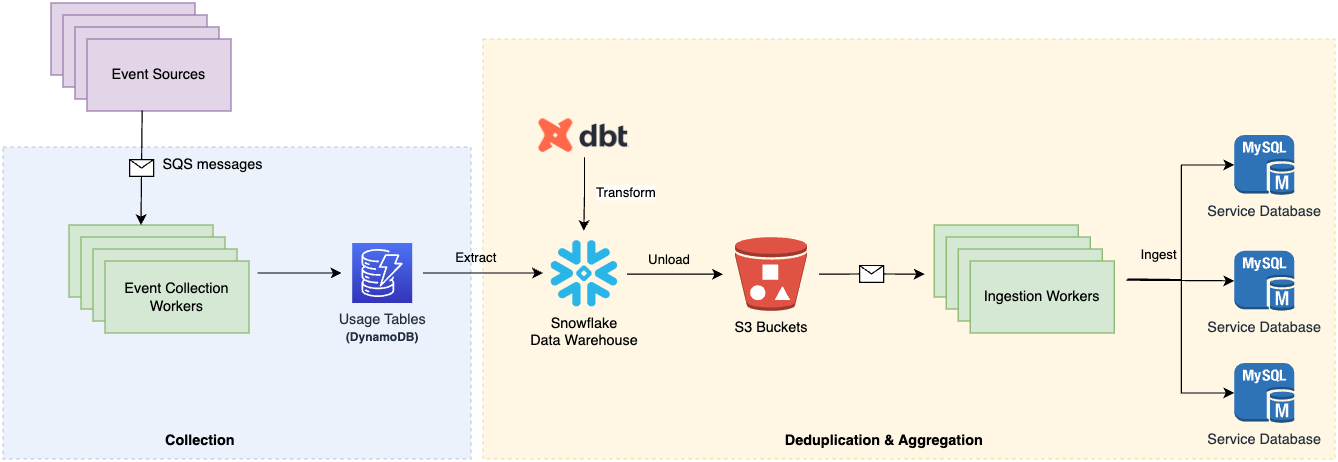 Our latest architecture with OLAP database.
The previous diagram shows our latest architecture, which incorporates:
- Moving away from OLTP (Online Transaction Processing) databases, to OLAP (Online Analytical Processing) databases, which provide scalable storage and computing.
- Moving away from using scheduled worker services for calculation, to using an ELT (Extract, Load, Transform) pipeline leveraging OLAP databases to perform end-to-end calculations.
The new pipeline architecture can now aggregate billions of usage events in only a few minutes and easily scale to handle the usage growth. The new pipeline also let us simplify our service codebase and the large amount of data we used to persist and maintain. Because of the enhanced reliability and simplification, we reduced the number of incidents from 1 or more in a month in the worst case to 1 every few months. Troubleshooting and recovery also became easier and more manageable.
Components
We built the core of the tracking functionality as a counting pipeline, divided into 3 stages with various steps in each:
- Data collection. We send usage events from various sources such as web browsers, mobile apps, and so on, then follow this with validation and filtering.
- Identify meaningful usage through deduplication. The service removes duplicated usage events and matches them with a set of specific classification rules. These rules define what we consider as distinct usages and how we should pay them.
- Aggregation. The service calculates total number of deduplicated usages based on different dimensions, such as per design template or per brand.
The following sections describe our architecture evolvement journey.
The Evolvement
Start with MySQL
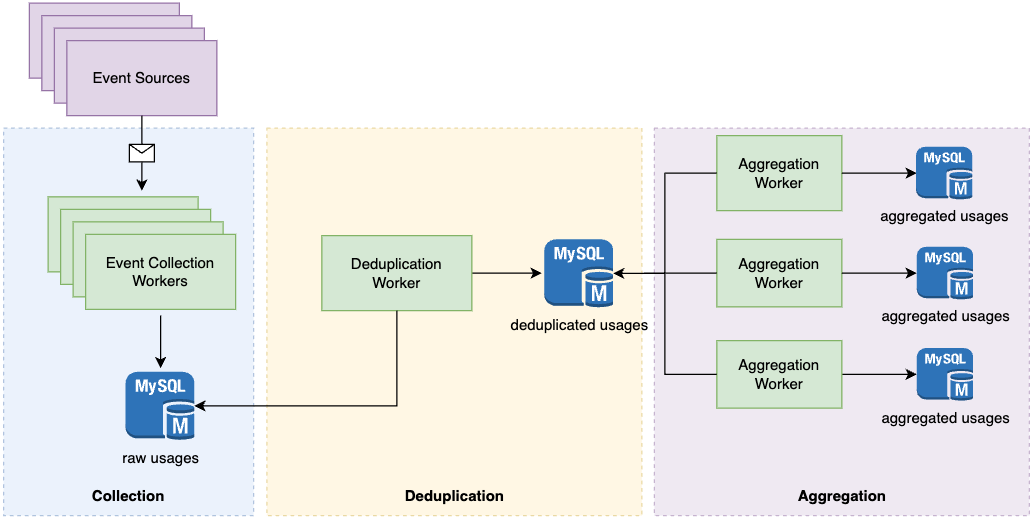 Our initial architecture using MySQL.
We started with the tech stack we were most familiar with, MySQL, and built major components separately using worker services. We also persisted multiple layers of reusable intermediary output. For example, the deduplication worker scanned the deduplicated usage table and updated every record by matching each of them with an event type. We then aggregated the results by scanning the updated deduplication table and incrementing the counter persisted in another table. This architecture worked well up to a point, with 3 issues: processing scalability, incident handling, and storage consumption.
Processing scalability
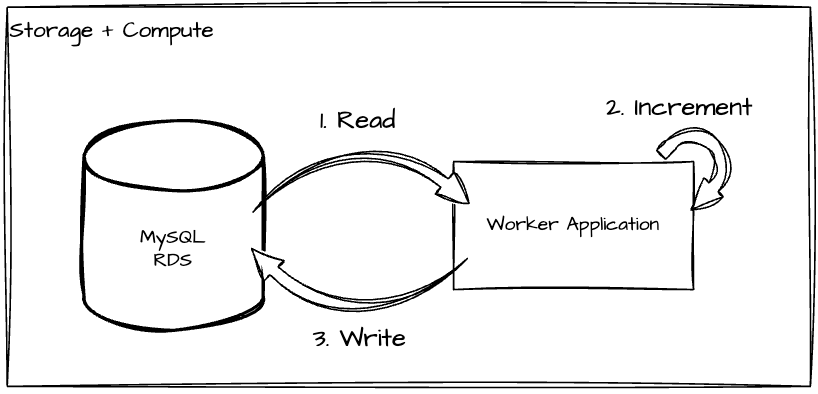 Increase total counts using database round trips.
The deduplication scan was a single-threaded sequential process, using a pointer storing the latest record scanned. This design was easy to reason about, especially when there was a problem or incident where we needed to verify the fix of broken data because it clearly told which records we had processed and which we hadn’t. However, it wasn’t scalable because processing each usage record resulted in at least 1 database round trip with 1 read of the event record and 1 write to increment the usage counter, as shown in the above diagram. Therefore a complete scan would take O(N) database queries, where N is the number of usage records. Batching is a straightforward optimization, but it doesn’t fundamentally improve scalability because O(N / C) is still O(N) given the constant batch size C. Multi-threaded scans would be another potential optimization, but it would significantly increase code complexity and make maintenance and troubleshooting harder.
Also, processing errors for any usage record would delay all of the following records, as well as subsequent processing stages.
Incident handling
Incident handling was daunting. Troubleshooting and recovery were difficult because they required engineers to look into databases and fix the broken data. We categorize the incidents we’ve experienced into below 4 types. The troubleshooting and recovery process for each varies.
Overcounting
Overcounting usually happens when an event source adds a new usage event type that should be excluded, without event consumers being aware. As a result, this new usage event type is mistakenly included in the deduplication and aggregation stages. Recovery from overcounting can require a lot of engineering effort. First, we need to identify the event types mistakenly included and pause the deduplication and aggregation pipeline. Next, we need to calculate how many of these events were processed, then remove them from the deduplication table and correct the data in the aggregation table.
Undercounting
Unlike overcounting, sometimes a new usage event type is added, which should be included for payment. However, the event source fails to integrate with usage services and the events aren’t aggregated. The fix for these incidents is to find the precise window of the missing data and collect the data from a backup data source. This is the most difficult step and often requires a non-trivial amount of time. After collecting the data from backup, we can backfill it into the service. Having a backup of all events is very helpful in these situations. The backfill can take up to several days depending on the volume, which could delay payment because of the processing scalability limit mentioned previously.
Misclassification
Misclassification is an issue that happens during deduplication. For example, a usage event that should be categorized into event type A, but we categorized it into event type B. The problem here is that we pay differently for different types. Many of our incidents fall into this category because the classification rules change from time to time. In the same way we handle overcounting, the recovery process for misclassification is also tedious. We first need to identify the root problem causing the misclassification, which is usually a bug in our code. Then we need to fix the code and pause the pipeline, followed by fixing the deduplication table data and all the subsequent table data by recalculation. Doing all of this requires days of effort to complete, with multiple engineers cross-verifying the output.
Processing delay
This was a performance issue resulting from the architecture, which used a single-threaded sequential scan and frequent database round trips. The processing speed was actually not bad in normal cases, and was able to catch up with the event traffic. However, in some special cases, the deduplication or aggregation worker got stuck for various reasons. For example, sometimes events contained unexpected data. This caused a delay to all subsequent aggregation processing.
Storage consumption
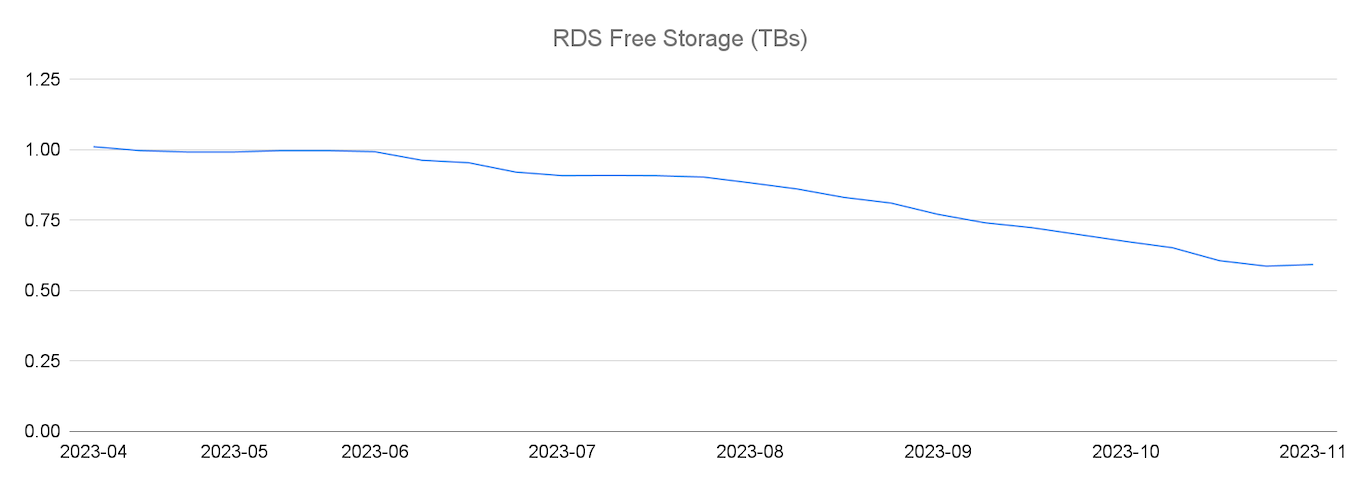 MySQL RDS storage consumption.
We consumed storage quickly. MySQL RDS does not horizontally scale through, for example, partitioning by itself. Therefore we doubled the RDS instance size every time we required more storage. This doubling happened every 8-10 months. The previous diagram shows that our free storage decreased by almost 500 GB, being 50% of the total free storage, within 6 months.
This architecture worked fine at the start until our MySQL RDS instance reached several TBs in size. Maintaining such a RDS required significantly more engineering efforts than we expected. For example, the database was initially shared with other critical features and any downtime could cause severe impacts to those functionalities. Regular database maintenance, such as version upgrades, became much harder too, because we always do upgrades with close to zero downtime, increasing our operational complexity. To mitigate these problems, we did a database split, and implemented some sweepers to clean up old data. Given the exponential traffic growth, it became obvious that increasing the RDS instance size further was not an optimal solution for the long term.
Migrate data to DynamoDB
Based on the lessons we learned, we made fundamental changes to the pipeline architecture to address these problems.
To meet the increasing scalability needs, we first moved the raw usage events in the collection stage, over to DynamoDB. This helped ease some stress on our growing storage needs.
Our next step was to move the rest of the data to DynamoDB, which would require rewriting the majority of the code. After evaluating the pros and cons, we decided not to proceed in this direction. The main reason was that while moving to DynamoDB could solve the storage scalability issue, processing scalability would still remain a challenge because we found it hard to get away from the database round trips.
Simplify using OLAP and ELT
Eventually, we decided to take a different direction, combining various steps in the deduplication and aggregation stages so that the service does an end-to-end calculation using source data directly.
This was a drastic move because unlike the incremental counting before, it required processing the usage data of the entire month that was twice larger, within a short time. Therefore this needed a lot more computational power. To do this, we used an OLAP database, for its advantage of being good at large complex data analysis and reporting. We chose Snowflake for most of the regions because it was already used as our primary data warehousing solution and we had reliable infrastructure support for it.
Extract and Load
We extracted our usage data from service databases and loaded it into the warehouse, using a data replication pipeline provided by our data platform. Data replication reliability is vital and we can’t accomplish this without a reliable data platform, so a huge thanks to the amazing work done by the Canva data team.
Transform
We then defined the calculation in each stage in scheduled data transformation jobs (using DBT(opens in a new tab or window)). We wrote each transformation as an SQL query, selecting data from its previous stage and outputting it to the next. Intermediate transformation outputs were materialized as SQL Views that are simple and flexible to change. The following is an example aggregating usages per brand, using data from the previous step named daily_template_usages. This also lets us avoid persisting and maintaining intermediary output of different pipeline stages.
selectday_id,template_brand,...sum(usage_count) as usage_countfrom {{ ref('daily_template_usages') }}group byday_id,template_brand
The following are the major steps:
- Extract from json data into structured SQL tables. We extracted source event data in json format from DynamoDB, which was not optimal for data warehouse query processing. Therefore we projected some of the json properties into separate table columns for optimization.
- Deduplicate and aggregate usage events. We defined deduplication rules to filter out duplicated usage events, and summed up total usage counts using GROUP BY queries.
Improvements and challenges
Improved performance and scalability
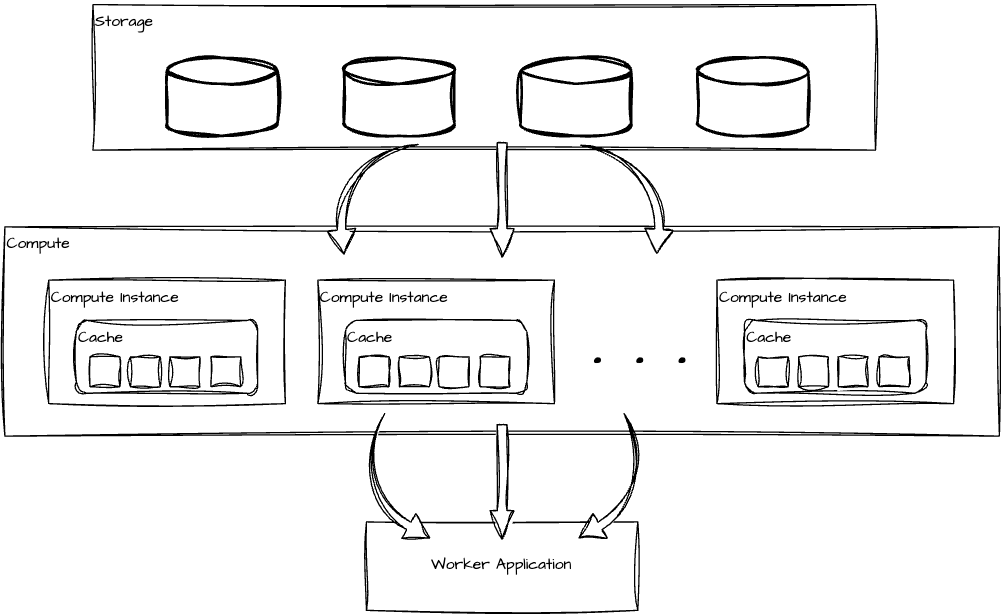 Data processing workflow with OLAP.
As shown in the previous diagram, an OLAP database like Snowflake separates storage and compute, such that we can scale its compute instances independently. In our case we can perform a complete aggregation of billions of usage records within a few minutes because most of the computation is now done in memory, which is several orders of magnitude faster than database round trips. We also reduced the entire pipeline latency from over a day to under 1 hour.
Reduced operational complexity
The incident impact and troubleshooting effort required was greatly reduced and became more manageable. We no longer have processing delay incidents. Although the remaining incident types (overcounting, undercounting, misclassification) might still happen, we can fix most of them by rerunning the pipeline end-to-end, without humans logging into the database to fix broken data that we often had to do before. Below diagram describes how we achieved this using the transformation defined in the aggregation step.
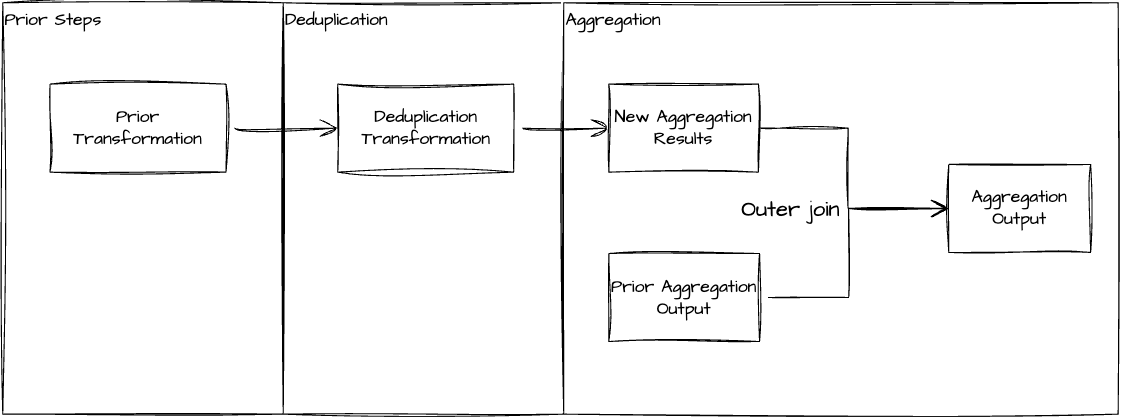 Aggregation transformation using an outer join to fix broken usage counts.
The aggregation query aggregates the output from the previous deduplication step, and compares it against the prior aggregated results through an outer join, such that the old results can be overwritten if they are found to be different. This lets us fix broken output resulting from overcounting, undercounting or misclassification, as long as the source data remains accurate. Some rules are given below. For example, if a template usage is misclassified into event type D whereas they belong to event type C, this will result in incorrect usage count of event C, and obsolete usage count for event D in the output. In this case, rerunning the pipeline will clear the event D usage count by setting it to 0, and correct the event C usage count.
Event type | Old count | New count | Output |
|---|---|---|---|
Event type A | X | X | X |
Event type B | X | Y | Y |
Event type C | null | X | X |
Event type D | X | null | 0 |
Simplified data and codebase
We reduced over 50% of the data stored, and eliminated thousands of lines of deduplication and aggregation calculation code by moving this logic to OLAP databases and DBT transformations. We rewrote the logic in SQL, which was surprisingly simpler compared to the previous code. The number of incidents also dropped to once every few months or fewer.
Challenges
- Transformation. The data transformation job uses an SQL-like language that we deploy as a standalone service separate from our main services. This makes the architecture less flexible. For example, the data transformation service has a different release schedule, so we had to consider compatibility when making schema changes. Maintaining a separate CI/CD pipeline for the DBT codebase also has extra costs.
- Unload data from the warehouse. We need a reliable pipeline that can unload data from Snowflake into databases used for other services because OLAP databases are not good at serving large volumes of requests with low latency within milliseconds. Therefore we built a scheduled worker that queries Snowflake periodically and choses S3 as an intermediary storage, integrated with SQS for its durability so that export data doesn’t get lost. The hard part was optimizing the ingestion query and carefully tuning the rate limit to control the throughput, such that it could ingest data with reasonable speed, without causing our service databases to throttle. The following diagram shows our RDS CPU usage spikes when ingestion throughput was too high.
- Infrastructure complexity. As mentioned previously, we can't carry out this work without sufficient infrastructure support. Therefore, it also increased infrastructure complexity resulting from the data replication integration and the standalone services running transformation jobs. For example, we need to put in extra effort to obtain observability of these parts because of the different toolings used.
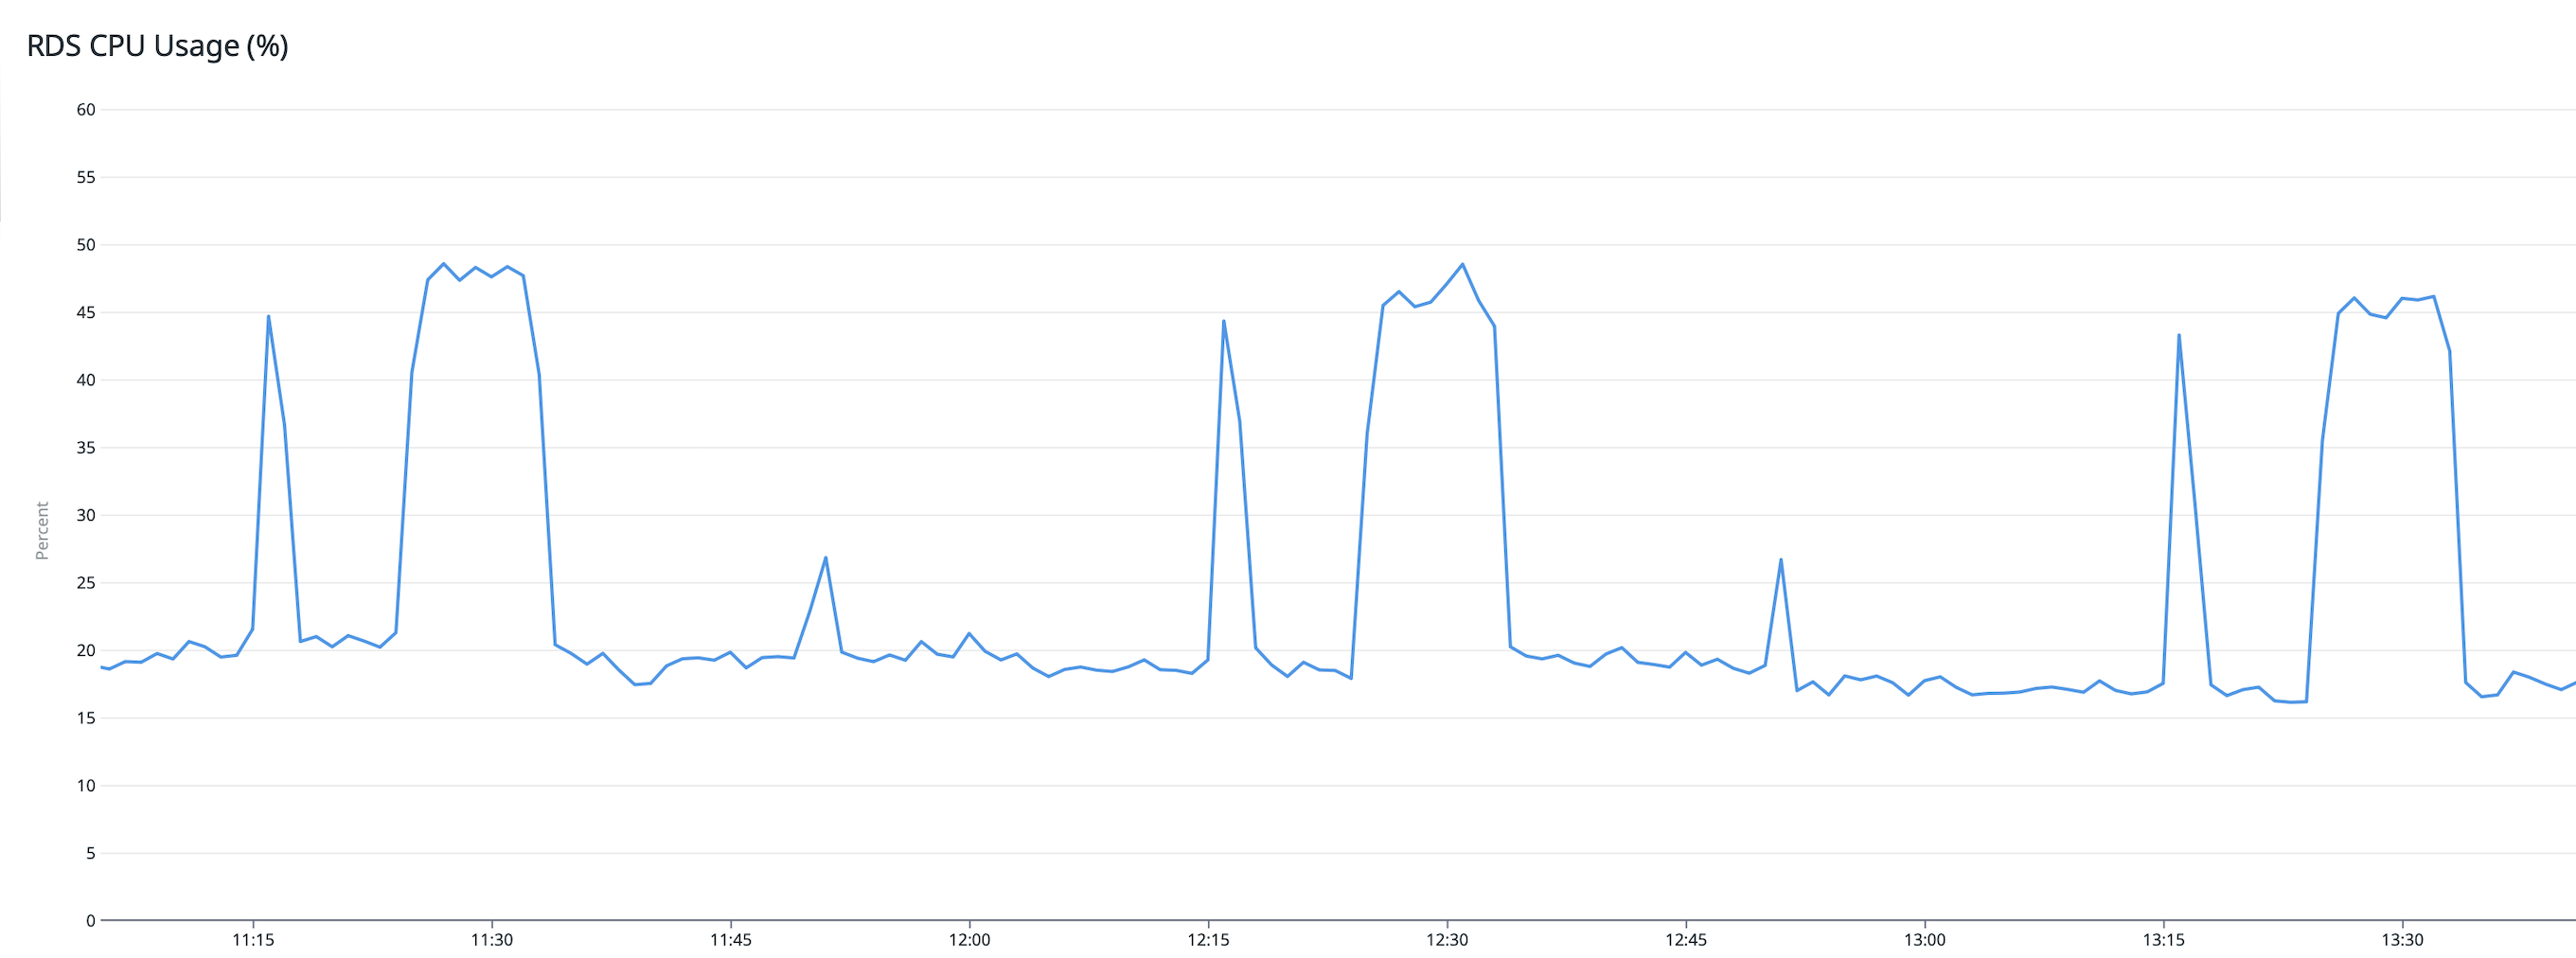 RDS CPU spikes during data ingestion.
Conclusion
This blog post first described the key challenges of our counting problem for creator payment. We then described our architecture evolvement journey, starting with our initial solution and the major problems, followed by some alternatives we tried, such as using DynamoDB and OLAP databases like Snowflake, with their improvements and trade-offs. Finally, here are some key lessons we learned:
- Simplicity is a key aspect of designing reliable services. This includes reducing the code and data complexity. Based on past incident handling experiences, we found that fixing problems in the code is generally easier than fixing broken data. Therefore, we minimized intermediary output persisted in various counting pipeline stages by computing the results end-to-end using OLAP and ELT.
- Start small and be pragmatic. We don’t consider the initial design with MySQL a bad choice. It served its purpose well in the first 2 years after launching the Canva Creators program. Using the initial architecture also ensured that we could deliver our functionality to users in a reasonable timeframe. Over time, scalability became the bottleneck. Therefore, we measured the data volume and its growth and considered our infrastructure's readiness before making any architectural changes.
- Observe from day 1. We tend to look closely at every part of the pipeline, such as the latency and throughput of unloading data from the warehouse to other service databases, RDS workload, and potential data missing in various places. This is because we find it hard to predict where a problem can happen, and it is rewarding, although it comes with extra overhead. It helps us understand everything going on so that we can quickly identify the problem.
Acknowledgement
A huge thanks to Jason Leong(opens in a new tab or window), Dafu Ai(opens in a new tab or window), Wenchuan An(opens in a new tab or window), Albert Wang(opens in a new tab or window), Jaime Metcher(opens in a new tab or window), Steven Wang(opens in a new tab or window), Grant Noble(opens in a new tab or window) for your review and valuable feedback, and Vikram Goyal(opens in a new tab or window), Liliana Huynh, Chris Hew for your help with publishing this blog post.